By Andrew Beer Chief Executive Officer of Beachhead Capital Management
The model for allocating to equity long/short funds is broken. The mentality of most allocators is to chase the “hot dot” – that is, invest with a fund that performed well recently and hope the hot streak continues. This approach is based on the discredited assumption that allocators can easily identify which funds will perform well going forward. In addition, the risk inherent in individual equity long/short funds is widely misunderstood – the equivalent of conflating the risk of a single stock with a diversified index. The net result is a decade of disappointment among clients who expected much and received little.
|
TABLE OF CONTENTS § Why Invest in Equity Long/Short Strategies? § Special Issues for Retail Investors § The Wrong Way to Invest in Equity Long/Short (Hedge or Mutual) Funds § How Allocators Defend Fund Selection § What’s the Solution? § Why Replication Works so Well With Equity Long/Short Strategies § Replication Example: Live Performance 2012-17 § Primary Benefits of Replication vs. Equity Long/Short Funds § Discredited Criticisms of Replication § Conclusion: The Wisdom of Crowds
|
The alternative (and, we argue, superior) approach is to reframe investing in equity long/short as a “category” allocation – akin to investing in a passive, diversified index at low cost rather than making concentrated bets on high fee, volatile individual constituents. In fact, the actual, live performance of a simple, factor-based replication portfolio we’ve managed since 2012 has outperformed 80-90% of individual funds on a risk-adjusted basis with low fees, daily liquidity and transparency – a package that, overall, should be far more compelling to any allocator seeking to include equity long/short strategies within a diversified portfolio.
The factor-based replication approach that we advocate is the culmination of ten years of research and provides a data-driven solution to the pitfalls experienced post-crisis by many investors in liquid alternatives products.
Why Invest in Equity Long/Short Strategies?
Why invest in equity long/short in the first place? The simple reason is that an allocation to equity long/short can improve the risk-adjusted returns of a diversified portfolio. Since January 2000, ELS hedge funds outperformed global equities with far less risk (see chart below).
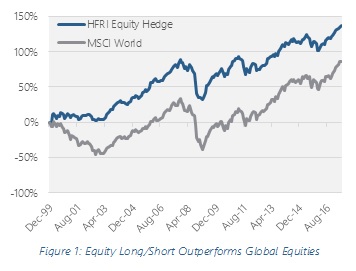
In a 60/40 portfolio, nearly 90% of portfolio risk comes from the equity allocation. The substitution of a 20% allocation to equity long/short from higher risk equities over this period of time would have improved the Sharpe ratio of a traditional portfolio by 24%.[1] Granted, equity long/short strategies are expected to underperform during strong bull markets, but historically this has been offset by the protection of capital during bear markets. Today, in the ninth year of the second longest bull market in history, at an important inflection point in monetary policy, the case for equity long/short is stronger than it has been in years – provided the implementation avoids some of the pitfalls outlined below. From a client management perspective, a proactive allocation that preserves capital during the next crisis should prove to be highly valuable.
Special Issues for Retail Investors
As we wrote about recently in a white paper,[2] retail investors have several constraints (relative to institutional investors) when considering an allocation to equity long/short strategies:
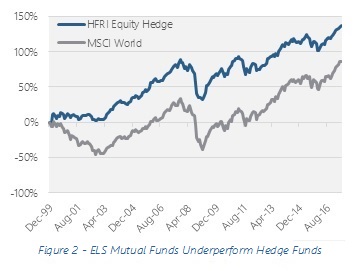
Retail investors can only invest in liquid alternatives, not actual hedge funds. If equity long/short mutual funds delivered comparable performance to hedge fund counterparts, this wouldn’t be a serious issue. The problem is that alternative mutual funds have tended to underperform hedge funds even after any potential fee savings. The chart to the right shows the performance of the ELS mutual fund universe vs. the HFRI Equity Hedge index over the past five years: mutual funds underperformed by close to 2% per annum and delivered half the alpha to global equities, a significant difference that can undermine the diversification argument.
Retail portfolios tend to have only one or two mutual funds or ETFs per asset allocation “bucket.” In other words, open a retail client’s statement and you’re likely to see XYZ Large Cap Core fund as the sole allocation in the relevant bucket. Similarly, a $1 million client with a 10% allocation to equity long/short is unlikely to be comfortable with a dozen $8,000 investments in different ELS mutual funds.
The Wrong Way to Invest in Equity Long/Short (Hedge or Mutual) Funds
The wrong way to invest in equity long/short is to pick one or two funds to “fill the bucket.” Why? Because individual ELS funds are highly risky – much, much riskier than most people realize. Although we’ll use ELS hedge fund data to illustrate the point, the pitfalls discussed below also plague retail investors in ELS mutual funds[3]:
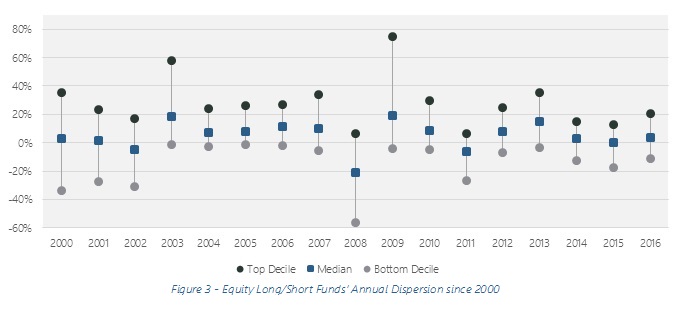
In a calm year, bottom decile funds underperform the top decile by 30%; in volatile markets, it’s twice as bad. The chart below shows the top decile, bottom decile and median performer in the ELS category in the HFR database since 2000. In other words, in 2016, while the median ELS hedge fund returned 4%, the top decile funds returned over 20% and bottom decile declined more than 10%. When most traditional funds are closet indexers, picking one fund works fine; however, as discussed below, the model fails with alternative strategies.
A good analogy is that investing in a single fund is like betting on a single stock: you can be very, very right, or very, very wrong. Imagine opening your quarterly statement and finding a single stock in your “Large Cap Core” allocation. Dispersion is the enemy of asset allocation models, since few investors will hold onto a fund that has underperformed the category by 20% or more. And, given that 20% of hedge funds close every year, that fund probably won’t be around anyway.
Irrespective of dispersion, individual fund drawdowns are much, much worse than people realize. One myth is that any given equity long/short hedge fund is less risky than, say, the S&P. In steady times, ELS funds look like low risk equities: short positions offset some of the risk of long positions. However, when markets diverge, the leverage inherent in shorting can lead to devastating losses – the very definition of a “fat left tail.” Case in point: over the past five years, the average maximum drawdown of an ELS hedge fund was -19%.[4] That’s more than double that of the S&P 500.
Given the structural constraints faced by retail investors described above, many advisors overallocated to highly-risky individual funds – Marketfield is the poster child of this problem.[5] For those not familiar with Marketfield, many allocators used this single manager fund as the proxy for the ELS space based on prior performance that appeared to show consistent outperformance relative to the index. When a poorly timed shift in the portfolio led to approximately 30% underperformance over eighteen months, over $21 billion – or 95% of the fund – was withdrawn. Many investors described this as an unpredictable outcome; however, the figures above underscore that this outcome is both predictable and common for single manager products.
How Allocators Defend Fund Selection
Professional allocators and advisors argue that they can select the right funds in advance – a typical refrain is “we only invest in top quartile funds.” Here are two reasons why that statement should be met with strong skepticism:
Like active mutual funds, active hedge fund portfolios almost invariably do not add value. The best data for this comes from funds of hedge funds, which have underperformed the average hedge fund by 200 bps per annum since 2000.[6] Not only did “manager selection” acumen fail to cover fund of fund level fees, but appears to have cost investors relative to a buy and hold strategy.
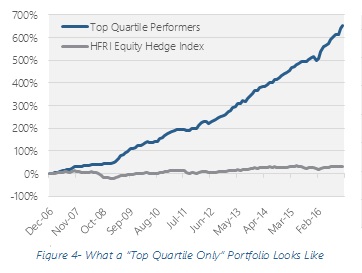
If they could actually pick the top quartile funds in advance, returns would be off the charts. To demonstrate how implausible this is, the chart to the right shows the returns of investing only in top quartile funds each year over the past decade. The portfolio would have returned 22% per annum with a max drawdown of 3% and Sharpe ratio of 3.2 – this is the hedge fund equivalent of saying “we only buy stocks that go up.” Wishful thinking, to say the least.
Given this, it’s clear why institutions spread their bets across a dozen or more funds. With years of experience, they know that highfliers one year might be dogs the next, or that a big winner this year is more likely than not to be offset by another blow up.
What’s the Solution?
To take a step back, allocators have three objectives:
- Deliver returns that are comparable to those of the equity long/short hedge fund universe (and avoid performance drag of many liquid alternative products).
- Avoid single manager and blow up risk.
- Offer a product available to retail investors with client-friendly terms (mutual fund/ETF/model delivery, low fees, daily liquidity).
In a recent white paper, Generation Two Liquid Alternatives, we discussed how the first generation of liquid alternative products generally failed to meet these objectives. The graphics below show how the institutional approach of allocating across a diversified pool of managers did not work in the liquid alternative space due to a lack of quality fund options and a bias to invest in only one (or two) funds per asset allocation bucket. The third option – replication of a universe of hedge funds – can meet the three key objectives outlined above:
| Institutional | Retail (Gen One) | Solution (Gen Two) |
 |
 |
 |
| Objective is to match or outperform the hedge fund index with close tracking error over time. | Unable to invest in a diversified portfolio of hedge funds, retail portfolios typically picked a single mutual fund to fill the “bucket.” | Performance of a diversified pool of hedge funds is replicated with low-cost liquid futures and/or ETFs in a mutual fund or ETF wrapper for a “one stop” low-cost solution. |
How Does Factor Replication Work?
There are several forms of hedge fund replication: top down, factor-based; alternative risk premia; or individual position copycats (e.g., 13F trackers). Each methodology has its advantages and disadvantages. We argue that the top down, factor-based replication is the most reliable methodology for the equity long/short space.
So, how does it work? Factor models seek to identify which markets (or market sectors) are the primary drivers of performance of a diversified portfolio of hedge funds. The theory is that if you can identify the key drivers, and how they’re changing over time, you can build a low-cost portfolio that will deliver similar results. Think of it this way: a portfolio of forty large equity long/short hedge funds will have investments in hundreds or, more likely, thousands of individual stock positions. Those positions can be grouped according to criteria like market cap, geographic region, sector, etc. If 15% of the dollar value of positions are classified as “large cap US,” the S&P 500 is highly likely to be an excellent proxy. A given fund’s top stock pick might significantly outperform the S&P, but on average the dozens or, more likely, hundred-plus stock positions will perform similarly to the index.
In practice, allocators can use statistical models to analyze the recent historical returns of a portfolio of equity long/short funds. As shown below, the models have proven to be very good at determining which markets are driving returns, and how much risk is in (or how hedged are) the hedge fund portfolios.
Why Replication Works So Well for Equity Long/Short Strategies
Allocators often describe the value added by equity long/short managers as driven by three sources: long-side stock selection, short-side stock selection, and market timing. This paradigm is outdated and fails to account for the importance of factor tilts. In fact, since the early 2000s, factor tilts have been the primary driver of ELS hedge fund “alpha”:[7]
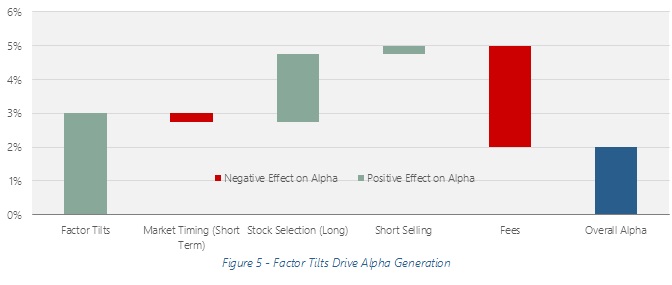
For most fundamentally-driven hedge funds, stock selection and factor tilts are interconnected. A key benefit of managing a hedge fund is the absence of constraints: whereas a large cap core mutual fund manager is limited to a small universe—the equivalent of “give someone a hammer and they will look for nails”—hedge funds have more flexibility. Pick any single stock in, say, emerging markets, and it won’t move the needle; but if the first stock leads to more and more positions over a few quarters, then stock selection morphs into factor tilts.
Factor tilts are much bigger drivers of performance than most people realize. We’re trained to think about returns rising linearly with risk – that is, small cap stocks should yield a bit more than large cap stocks over time. That might be true over twenty year time periods (the jury is still out on this…) but over a year or two or three, factor tilts are incredibly important. For instance, looking at just five major stock market categories – S&P 500, Russell 2000, Nasdaq, EAFE and Emerging Markets – the average annual spread between the top and bottom performer is 26.9%.
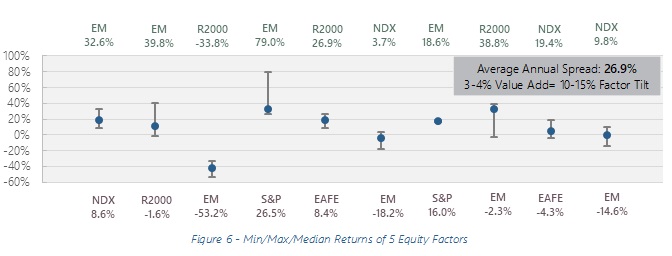
That means a relatively small (10-15% factor tilt) can make all the difference between a good year and bad one. Traditional hedge fund investors find this concept difficult to digest. Primarily, stock selection stories are a cornerstone of the mythology of the talented hedge fund manager, whereas factor tilts are the domain of the asset allocator. However, the math is clear: a thirty percent allocation to emerging markets was typical for ELS funds in 2005-07 when those markets outperformed the US by 30% per annum – this factor tilt accounted for 900 bps per annum of hedge fund alpha during the “golden years” and dwarfed that from stock selection. In other words, the fact that hedge funds owned emerging market stocks was much more important than which stocks they owned. Similar analyses explain alpha generation in 2000-02 and recent years.
Replication Example: Live Performance 2012-17
The strategy tracks the pre-fee performance of forty leading equity long/short hedge funds. We rely on statistical models that analyze the performance of those funds over the preceding year or so. The models are highly effective at breaking down which factors have been driving returns recently – especially for fundamentally driven equity long/short hedge funds where exposures tend to shift slowly over time. An analogy is that the portfolio of funds is like a tanker, and we analyze the wake in order to understand its direction and speed; each month we get new imagery (data) and adjust accordingly.Since 2012, we have managed an elegantly simple replication-based strategy – currently available only in managed accounts or via model delivery platforms – that seeks to capture the alpha from factor tilts at low fees. In essence, we seek to deliver the pre-fee alpha from factor tilts of a group of leading hedge funds; with a 300 bps head start on fees, we should be able to match or outperform actual hedge funds without any alpha from individual security selection. When targeting pre-fee return, fee reduction is pure alpha.
In the five years to June 2017, the strategy outperformed the (liquid but expensive) HFRX Equity Hedge index by approximately 300 bps per annum, (liquid but still moderately expensive) equity long/short mutual funds by 190 bps per annum, and slightly outperformed the (illiquid, high cost and uninvestable) HFRI Equity Hedge index.
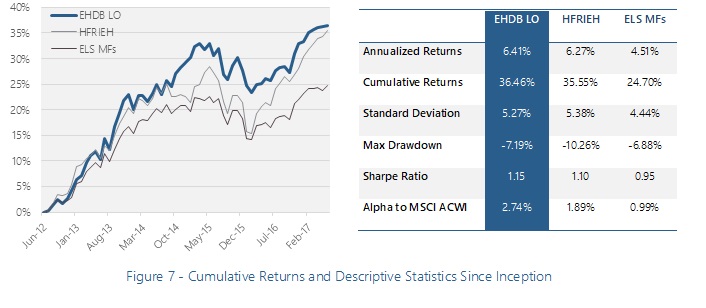
Importantly, the strategy has delivered annualized alpha to the MSCI All Countries index of 274 bps since inception. One explanation for the performance gap is the strategy’s ability to dynamically shift equity exposures as investment opportunities materialize in different geographies around the world. A prime example of this phenomenon: the strategy eliminated its exposure to emerging markets in favor of large cap US equities during 2013 and 2014, when emerging markets underperformed the S&P 500 by 34.6% and 15.6% respectively.
Primary Benefits of Replication vs. Equity Long/Short Funds
Factor replication solves five significant issues for investors in equity long/short funds:
- Low fees. Low fees eliminate the “heads you win, tails I lose” problem with the hedge fund fee structure. We estimate that fees consumed 80% of ELS alpha over the past ten years;[8] in one notable example, a manager was paid $1 billion in performance fees in 2014 yet did not have a clawback when the same fund declined over 30% in the subsequent 24 months. Even for a mutual fund like Marketfield, we estimate that more than $500MM was paid in fees before investors lost $1BN since inception.[9]
- Daily Liquidity. Daily liquidity eliminates the risk of gating/suspension that plagued hedge fund investors in 2008-09.While often ignored, a liquidity-adjusted evaluation of hedge funds should penalize those with quarterly liquidity by 1-3% per annum relative to daily liquid products.
- Outperform indices. We believe that by replicating “pre-fee” performance, a well-designed replication strategy can match or outperform actual hedge funds, and materially outperform liquid alternatives like mutual funds and investable hedge fund indices.
- Reduce Blow Up Risk. By replicating a diversified pool of hedge funds (in our case, forty large, established funds), allocators reduce or eliminate the blow up risk inherent in individual funds.
- Exert greater control over tax efficiency. ELS hedge funds can be notoriously unpredictable in terms of tax treatment, especially once they grow and investors are predominantly institutional. In one example, investors in a flagship hedge fund were allocated 20% short-term capital gains even through the fund’s NAV had declined by more than 25%. In the mutual fund space, it is common for new investors to get hit with tax distributions for prior years.
Discredited Criticisms of Replication
The concept of replicating hedge funds has been around for ten years. The strategy has withstood numerous criticisms from advocates of hedge funds. Those are summarized below:
- “Hedge funds are nimble so a backward-looking model won’t work” (c. 2007). This is accurate for trading-oriented discretionary macro managers or CTAs, but simply is not true for the vast majority of fundamentally-driven equity long/short funds that tend to make investments in companies with a 3-5 year time horizon. The other issue is that the evidence suggests hedge funds are poor near-term market timers (see 3Q 2011).
- “Hedge funds are absolute return vehicles with no market exposure” (c. 2007). Before the crisis, hedge funds with a high percentage of illiquid assets often did not mark assets to market, which created the appearance of no market risk. Clearly, the crisis disproved this when funds were forced to mark down illiquid assets in the wake of Madoff.
- “Hedge funds make money from shorts” (c. 2010). Most alpha from shorts was due to interest earned on the short rebate; a decline in interest rates and changes in the stock lending market eliminated this post-crisis.[10]
- “Replication doesn’t pick up stock selection alpha” (c. 2012). True, but the evidence on stock selection alpha is mixed. Popular hedge fund positions tend to perform well in stable markets, but underperform badly during down markets or with heightened position crowding.[11] Consequently, individual stock picking only adds value at the margin, and certainly not enough to cover hedge fund fees.
- “Replication doesn’t pick up the illiquidity premium” (c. 2012). True for hedge funds that actually invest in illiquid assets, like distressed debt. However, ELS funds typically have a de minimus percentage of their portfolios in illiquid assets, and therefore investors give up liquidity by locking up money without a commensurate pick up in performance.
As we noted recently, myths die hard.[12] Widespread criticism of hedge fund fees and performance has caused investors to question many of their assumptions about hedge funds. Today, most sophisticated allocators recognize that replication-based models can match or outperform hedge funds when applied to appropriate segments of the industry. This distinction is key: what works well for fundamentally-driven equity long/short strategies won’t work well for fast-moving CTAs; no strategy has proven effective for the most illiquid strategies or for truly asymmetrical payoff profiles, like shorting subprime.
The disappointing part of this is that allocators should have kept an open mind and, years ago, rationally evaluated the evidence. Instead, they circled the wagons. A decade ago, several consultants published white papers attacking the concept – generally without any supporting evidence. Even some academics apparently sought to perpetuate hedge fund myths at the expense of replication.[13] Cynically, none of the critics publicly revised their initial conclusions as the evidence mounted to the contrary. Even today, funds of funds that privately acknowledge the effectiveness of the strategies refrain from using them out of fear of accelerating the disintegration of their core business by further calling into question their ability to select managers who will outperform.
Conclusion: The Wisdom of Crowds
Replication reflects the “wisdom of crowds”[14] as applied to factor investing. The concept is that large crowds of independent decision makers can make better estimates or guesses than even the best experts among them. The data above shows that hedge fund managers on average are very, very good at deciding which markets are more attractive than others, and shifting their exposures accordingly. Sure, in any given year, one manager may get everything right, but many others won’t.
In many ways, this debate mirrors the larger passive vs. active debate. The gamble on a manager on a hot streak is more exciting than the slow-and-steady approach, even if the latter wins over time. However, the risk of picking the wrong manager in a concentrated portfolio can be catastrophic. Instead of gambling on one or two managers, retail investors are much better off thinking of equity long/short as an investment category whose contours are traced by a crowd of managers. By dispensing with the mythology of the singularly talented hedge fund manager, investors will benefit from portfolios built to capture factor tilts, which are the more reliable driver of hedge fund returns over time.How does the wisdom of crowds work in practice? It typically is the culmination of repeated fundamental, bottom up assessments of how attractive one stock is relative to another. A smart, motivated, manager might look at hundreds of stocks a year, and make hundreds of relative value comparisons. Is this large cap US healthcare stock more or less attractive than a mid-cap European competitor? These assessments are made on a nuanced level to incorporate “soft” factors like geopolitical risk, shareholder rights, liquidity and other factors. Over months and quarters, the portfolio shifts to reflect this analysis. Walk into a typical fund in 2006 and you would hear about the growth drivers behind emerging market stocks; the same fund in 2013 might have described instead the attractiveness of a well-run, large cap US technology company with dominant local market share. Both calls were legitimate “alpha” trades: in 2005-07, emerging markets outperformed the S&P by 27% per annum, while the S&P 500 outperformed the former by 21.5% per annum over 2013-15. As noted above, just among major markets (US large cap, US small cap, emerging markets, etc.) the winner each year outperforms the loser by 25-30%—a far cry from what we’d expect based on academic models of how returns should closely track volatility over time.
[1] The traditional portfolio consists of a 60% allocation to the MSCI World Index and a 40% allocation to the Barclays US Aggregate Index. The comparison portfolio replaces one third of the equity allocation with the HFRI Equity Hedge index.
[2] Generation Two Liquid Alternatives: Built for the Needs of Allocators. Beachhead Capital Management (2017).
[3] This data is drawn from the HFR hedge fund database. Hedge fund data is far more robust than that for alternative mutual funds, where the population is much smaller and track records much shorter.
[4] 445 equity long/short hedge funds in the HFR database that were around five years ago and still report today. Another 500 or so that died or stopped reporting – so the sample literally is the cream of the 2012 crop (the “survivors” outperformed the HFRI Equity Hedge index – which includes the “dead” funds – by 155 bps per annum).
[5] See Beachhead Capital’s guide to Generation Two Liquid Alternatives and blog posts here.
[6] As measured by the relative performance of the HFRI Fund of Funds Index and the HFRI Fund Weighted Index.
[7] See Beachhead Capital’s article on How Equity Long/Short Funds Really Generate Alpha.
[8] See The Hedge Fund Fee Structure Consumes 80% of Alpha, published in the Financial Times in June 2016 by Andrew Beer.
[9] See Chasing Fund Returns is a Very, Very Bad Idea.
[10] See Changes in Short Selling.
[11] See The GS VIP Lists and What They Tell us About Larger Hedge Funds.
[12] See Andrew Beer’s FundFire interview here.
[13] See Factor-Based Replication: A Re-Examination of Two Key Studies
[14] For an excellent description, see James Surowiecki’s The Wisdom of Crowds.
By the same author:
Multi-Strat v Fund-of-Funds: Multi-Strat Has Won Out Because Of Flexibility (March 2015)
Related Content:
