
By the Capital Solutions Team of Barclays Prime Services*
In light of the recent performance of event-driven HFs, we wanted to understand how it had affected investors’ perceptions of the strategy, and what their likely allocation plans were with regard to event driven strategies as a result.
Performance versus investor expectations
We began by asking investors how their event driven portfolios had performed relative to their expectations over the last 12 months, as shown in Figure 1. The overall sentiment was clearly not positive, with no investors reporting that their event driven portfolios had delivered performance above expectations. Over two-thirds perceived the performance of their event driven HFs as being below expectations, while the remainder felt performance was as expected, or mixed. Those investors who cited mixed or ‘at expectation’ performance from their event driven portfolios tended to have managers with exposure higher up in the cap structure, minimal exposure to energy and crowded names, and a higher allocation to hard catalyst events.
![]()
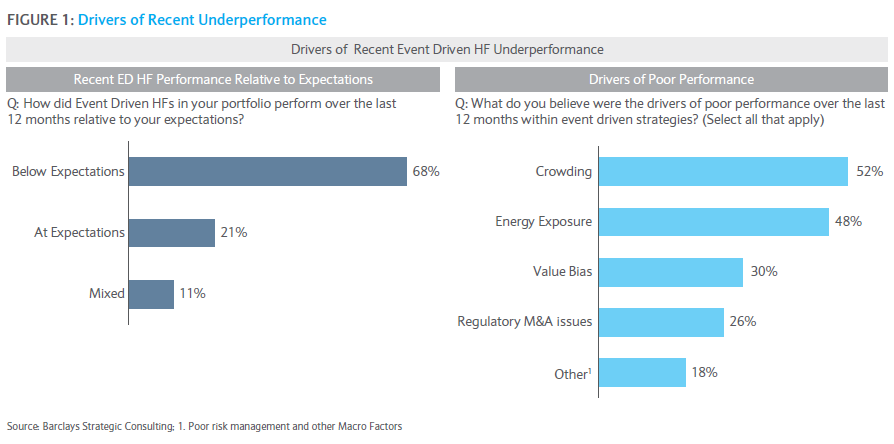 We also asked investors what they attributed underperformance in event driven strategies to. Consistent with what we noted earlier in this report, crowding and energy exposure come at the top of investors’ list of concerns, for the reasons already discussed. Beyond that, a few other issues were cited:
• Value bias – Investors suggested that equity event managers tend to have a natural skew in their portfolios toward value stocks; during 2015, value as a factor underperformed the broader markets.
• Regulatory issues in M&A – The rejection of certain deals in recent years by regulatory authorities (e.g., those with a tax inversion element) was cited by some investors as having weighed on event driven performance.
• Other – Investors also cited poor risk management by certain managers (in particular a failure to hedge properly and a tendency to hold onto losing trades), as well as the broader macro backdrop, as factors that contributed to the poor performance of event driven strategies.
Manager selection
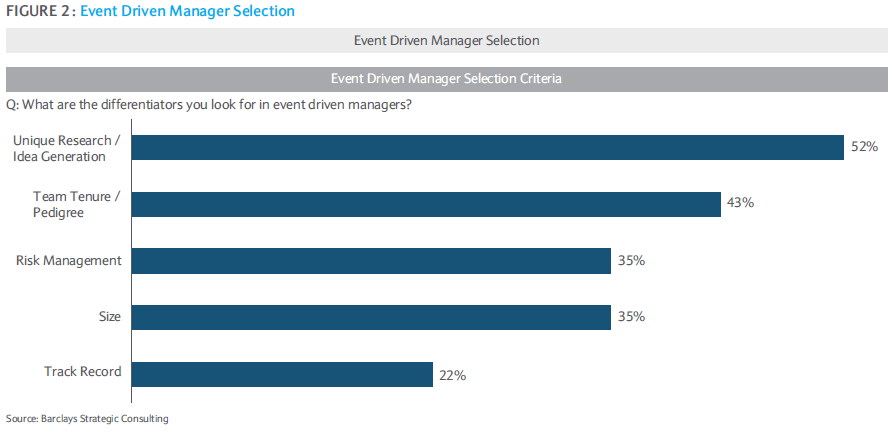
As a result of these recent performance challenges, we wanted to understand whether investors’ criteria in selecting event driven managers have changed. Figure 2 outlines the criteria that investors in event driven strategies told us they value; all are common factors in manager selection, but it is the order
in which they are prioritised that is quite telling at this point in time.6
1. Unique research / idea generation
Given the level of crowdedness of trades in 2015, investors are prioritising allocating to managers with a unique or differentiated research process and idea generation at this point in time as they look to return a level of diversification to their portfolio.
2. Team tenure / pedigree
There were certain types of event driven managers that did considerably better than others last year – for example, managers with more exposure to hard rather than soft catalyst trades tended to outperform. In light of this, investors are cognizant of the importance of finding managers who have
experienced different market regimes and navigated numerous cycles and thus may be better at identifying the correct time to build exposure to different situations and strategies.
3. Risk management
As mentioned earlier, one concern in 2015 performance cited by some investors was a failure of certain managers to adequately manage the risk of their portfolios. This may have included not being properly hedged (e.g., running a book such that it had exposure to certain factors / sectors which could then hurt
performance even though they may have appeared to have had relatively little market or beta exposure), or a tendency to hold onto losing trades for too long. As such, strong risk management is of increased concern at this point in time.
4. Size
While over the last few years a large majority of net inflows into the HF industry have been to $5bn+ managers,2 investors now appear to be more focused on sourcing smaller managers in the event driven space. This is likely due to a combination of two factors: firstly, the underperformance of the largest event driven funds in the second half of 2015 as noted earlier, and secondly, as part of the desire to have greater exposure to more differentiated trades, which may be more easily found with smaller managers.
5. Track record
This is a corollary to the earlier point around the tenure and pedigree of event driven managers: for similar reasons, investors are now also focused on finding HFs with a long track record and demonstrable experience of generating returns in different market environments.
Expected changes in event driven allocations
As a result of the issues discussed throughout this paper, investors in event driven do not appear to be particularly bullish on the strategy. As Figure 3 shows, only around a quarter plan to increase their allocations, while over half plan to keep the allocations stable and around 20% plan to reduce them. This is somewhat more bearish than the general sentiment toward HFs.3 Moreover, when one accounts for the fact that these forward-looking surveys tend to display a persistent bias toward optimism, the outlook for event driven does not appear to be particularly rosy at the moment.
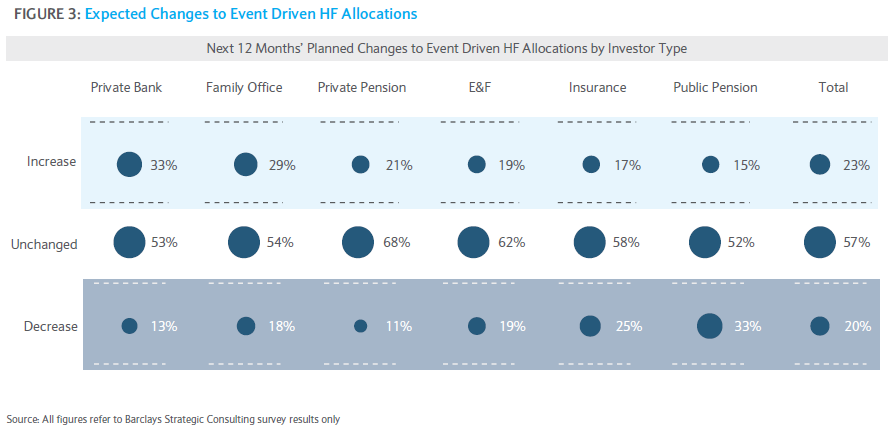
Across the different investor channels, it appears that private institutions are more bullish toward event driven strategies, with private banks and family offices most likely to be looking to increase allocations. Institutional investors – notably insurers and public pensions – appear to be the least interested in the strategy on the other hand, with fully one third of public pensions looking to reduce their allocation. This is possibly due to their heavier exposure to the larger funds that underperformed last year.
Investors’ sub-strategy preferences
Not all strategies within event driven are created equal, however. There is a wide range of levels of interest in the sub-strategies, as illustrated in Figure 4. Distressed and merger arbitrage are the most popular at this point in time. From our conversations with investors, it appears there is a degree of
nuance to this – the popularity of distressed is a less immediate view, as investors are looking to increase exposure here due to a perceived possibility of greater opportunities in the US distressed space later in 2016. Merger arbitrage appears to be viewed as a more immediate opportunity set (and indeed through Q1 was the only sub-strategy within event with net inflows).4
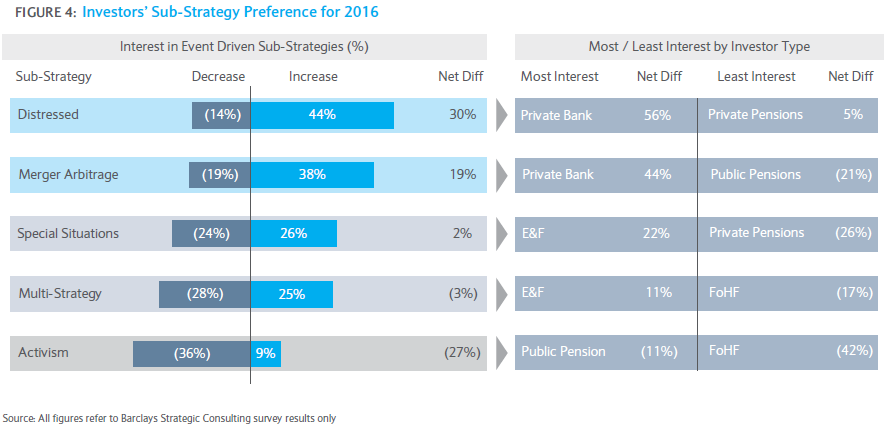
Special situations, multi-strategy event and activism all appear to be out of favour at the moment, and this was confirmed in Q1 as all had outflows: within these it was special situations and activist managers that bore the brunt of outflows, seeing $3.4bn and $4.3bn of net outflows, respectively.
Projected event driven flows
Despite the expected net outflows from event driven, there is still significant ‘money-in-play’ within the space. In Figure 23 we estimate the total gross inflows and gross outflows in order to account for the reallocation between managers. By this measure, we believe that there will be $60 – $70bn of gross
inflows as investors rotate capital out of underperforming managers and reallocate between strategies. As such, managers that belong to the more in-demand strategies and those that have differentiated their performance to the upside should still be able to find asset raising opportunities in 2016, although it will be a challenge.
CONCLUSIONS
1.Recent performance seems mainly to have been driven by crowding in US special situations and the credit cycle in distressed.
• Investors and managers that we spoke to believe that recent underperformance has largely been driven by problems associated with crowding, especially in US special situations trades, and widening distressed spreads in the energy space in particular.
• Building a diversified event driven portfolio in terms of both manager size and regional focus may have helped some investors to alleviate some of these challenges.
2. Asset raising in 2016 is likely to be a challenge for event driven managers in general, but there is still significant ‘money-in-play’.
• We expect a total of $10bn of net outflows from event driven managers this year, although some strategies will likely fare better than others:
–– Activist, in particular, is likely to see significant outflows, with special situations and multi-strategy event also likely to suffer outflows, albeit to a lesser extent – these managers should plan to play defence with regard to trying to retain assets.
–– Distressed and merger arbitrage, we expect, should see inflows, with investors seemingly bullish on the opportunity set for both.
• Even for those strategies that we believe will have net outflows this year, there will still be significant ‘money-in-play’ as investors look to reallocate, so managers that have distinguished themselves lately should aim to capitalise on this.
1. As an example of how this changes over time, in the immediate aftermath of the 2008 financial crisis, investors tended to value transparency in particular; since that time, its importance as a criterion has faded somewhat to the point that it no longer tends to be at the top of investors’ priorities. See ’28 Months Later’, a Strategic Consulting publication from 2010, as a reference
2. See 2016 Strategic Consulting publication ‘Bracing for Impact’
3. Ibid; the findings in that paper suggest that 33% plan to increase vs. 15% decrease
4. Source: HFR
*This is an extract from the study Barclays Hedge Fund Pulse – “Hanging Tough – Landscape and Recent Developments in Event Driven Strategies”. For the study the Strategic Consulting team sought input from 15 event driven HF managers and nearly 300 investors accounting for ~$7.5tn in total AUM.
Related articles: