
By Alastair Sewell, Manuel Arrive, and Brian Knudsen of Fitch Ratings
Summary
Strong Growth, Low Base: Fitch Ratings estimates that open-ended Europe-domiciled loan funds have had strong average annual growth of 50%-60% over the last five years. However, this comes from a low base: Fitch estimates total assets of just EUR40bn across all European open-ended funds at end-June 2016, with most investing in US and European leveraged loans rather than having a pure European focus.
Europe Materially Behind US: Loan fund assets in the US are substantially greater than in Europe, at around USD110bn as of end-June 2016. This is a function of size – the US loan market is roughly four times larger than Europe’s – and the fact that loans are not eligible assets under Europe’s UCITS fund regulation, which precludes retail investment. Loan funds in the US are actively sold to retail as well as institutional investors.
Wider Sector Approaches CLO Levels: Fitch estimates that collectively the share of new issuance acquired by loan funds and separately managed accounts in Europe is now only marginally smaller than that of CLOs. This makes funds and mandates collectively a significant institutional loan investor group.
Fund, CLO Allocations Comparable: European CLOs and loan funds broadly invest in the same sectors in roughly the same proportions. However, there are some important differences. European loan funds can, and do, have greater maximum issuer and industry exposures. They are also more able to invest in non-base-currency exposures, which may support diversification while introducing foreign-exchange risk. European CLOs primarily invest in euro-denominated leveraged loans.
Liquidity Terms Untested: Redemption terms on open-ended European loan funds are typically longer than for fixed-income funds more broadly. Most loan funds offer monthly liquidity with a notice period, whereas most bond funds offer daily liquidity with T+3 settlement. This difference recognises that loans can be less liquid than bonds, but it is far from certain that funds could sustain liquidity in the event of severe market stress, especially given potentially long loan settlement times in Europe.
Lower Loan Capital Charges: Loans that are not publicly rated are treated as unrated exposures under Solvency II’s standard formula, and carry lower capital charges than would be assigned to ’BB’ or ‘B’ rated credits of similar duration. They also carry significantly lower capital charges than even the shortest duration and most senior tranches of Type 2 securitisations such as CLOs.
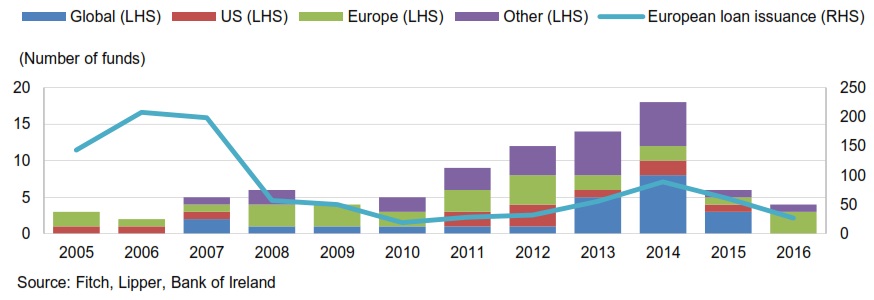
European-Domiciled Fund Lauches Peaked in 2014
Correlation with primary market issuance since 2010
Sizing the Sector: High Growth, Low Base
Fitch Ratings estimates that total assets under management (AUM) held by open-ended European-domiciled leveraged loan funds are close to EUR40bn. AUM in these funds have grown rapidly, at an annualised rate of 50%-60% over the five years to June 2016. Open-end funds domiciled in Europe with a global (majority US, minority Europe) focus are the largest segment, according to Fitch estimates.
Globally focused funds have had strong growth, which Fitch estimates at an annualised rate of just under 50%. Europe-domiciled open-ended funds focusing on the US have grown faster, at an annualised rate of 65%. This growth is significant, but the base was low and the open-end sector overall remains extremely small compared with European loan funds broadly (including closed-end funds and separately managed accounts) and other mutual fund segments.
Substantial Growth in Open-Ended Europe-Domicilied Loan Fund Assets from Low Base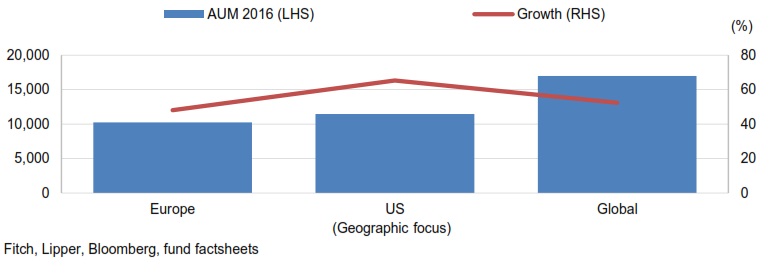
The growth in European loan funds (and CLOs) is closely correlated with loan primary issuance in terms of numbers of fund launches and AUM development.
Sharp Contrast with US Onshore Loan Funds
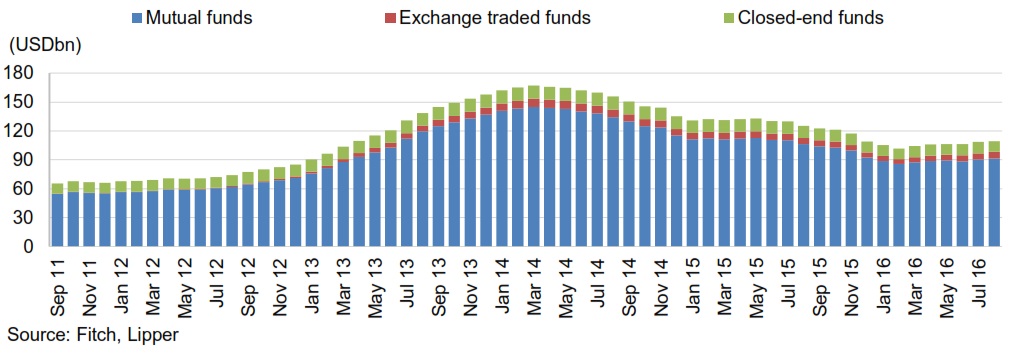
The growth rate in open-end Europe-domiciled loan funds has been substantially greater than that of US-domiciled funds, at around 20% annualised. However, the scale is vastly different: US open-end loan funds had AUM of USD110bn as at end-June 2016 (consisting of around 80% open-ended mutual funds).
The reason for this difference is twofold: first, the US loan market is much larger (about four times as large as Europe’s, or about USD2trn, compared with USD485bn in Europe) and has been growing; second, in Europe loans are largely excluded from retail fund vehicles, whereas in the US retail loan funds are permitted. Under the UCITS regulation in Europe loans are considered non-transferable and are therefore largely ineligible for inclusion in the portfolios of such funds. This reflects the long, administratively intensive settlement process, on average 10 days, for European leveraged loans, according to loan fund manager estimates.
US-Domiciled Loan Funds AUM
Peak in 2014
Funds and Mandates Approach CLO Manager Primary Market Equivalence
Strong demand from Non-CLO institutional Investors
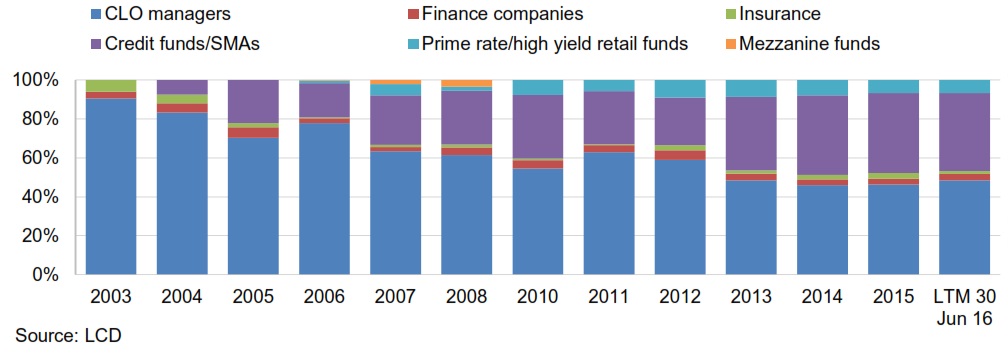
Aggregate European-Domiciled Loan Fund Sector Equals CLOs
European-domiciled loan funds and separately managed accounts now represent just under 30% of the European loan primary market in aggregate – ranking just behind CLOs among institutional loan investors. The share of loan funds and separately managed accounts in primary issuance has been growing over time, with investors showing a preference for closed-over open-ended vehicles for loans. Closed-end funds and separately managed accounts represent the majority of the loan fund universe in Europe.
The development of the loan funds and separately managed accounts has been driven by the steady demand from institutional investors, whose ownership of new loans increased from around 30% to 60% between 2010 and 2016. Meanwhile, bank deleveraging reduced the share of new European loans owned by banks from 66% to 33% over the same period.
Structural Features Differentiate European CLOs and Funds
CLO and Loan Fund Allocations Broadly Comparable
European-based CLOs and loan funds have a high degree of comparability in their sector allocations. This suggests that selectivity overall is low in the industry, perhaps due to the bottom-up credit selection process, which focuses on primary market issuance rather than the secondary market, which dominates the sector.
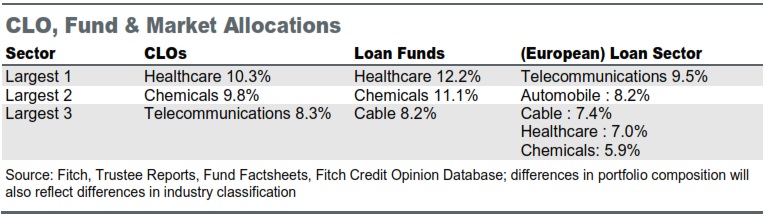
However, there are important distinctions: first, funds are much more able to acquire non-base-currency exposures and therefore open up a range of different issuers that are not necessarily directly accessible for CLOs in any quantity, albeit at the expense of introducing foreign exchange risk. Most European CLOs have a majority of euro-denominated assets and liabilities. This means that global loan funds can be substantially more diverse than CLOs.
Second, the funds may have much less restrictive investment guidelines than the CLOs. Funds may allow exposures of up to 20%-25% per industry or up to 5%-7.5% per single issuer, whereas in a CLO large industry or issuer concentrations have a strongly credit negative effect when rating CLO liabilities. Similarly, at issuer level the funds can choose to be significantly more concentrated by issuer, although in most cases individual issuer exposures averaged less than 1% in funds reviewed by Fitch, with maximum actual exposures up to around 2.5%.
Credit quality across loan funds and CLOs is broadly comparable. Across the sample of European loan funds reviewed by Fitch the funds are largely invested in ‘BB’ and ‘B’ issuers, similar to CLOs and consistent with the market’s credit quality (new issuance credit opinions were concentrated in the ‘B’ rating category in 1H16, see: European Leveraged Loan Chart Book – 2Q16). However, this information is not routinely provided in a readily accessible manner by funds.
Third, loan funds may not be restricted to loans only: they may be able to invest a greater portion of their portfolio in bonds than CLOs or may even be able to invest in related asset classes such as commercial real estate loans or infrastructure debt. However, investing in these asset classes brings with it the additional challenges of the specific credit research expertise needed and potentially different risk-reward and liquidity profiles.
Liquidity Risk Management Key Issue for Open-Ended Funds
The key difference between open-end loan funds and other fund vehicles such as CLOs and closed-end funds is liquidity risk and its management. The Europe-focused funds in Fitch’s sample typically offer longer redemption cycles than other fixed-income fund types, which typically offer daily liquidity irrespective of asset class (see Little Differentiation in Euro Bond Fund Liquidity Provision).
Liquidity Provision Skewed to Lower Frequencies
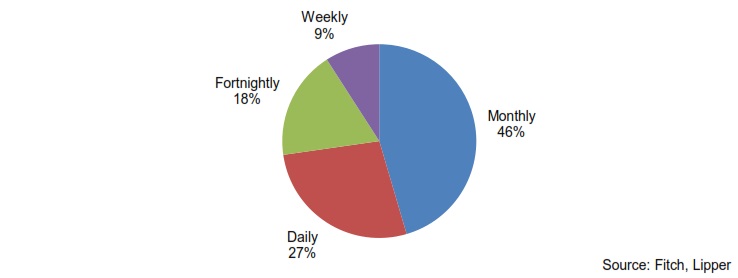
However, loan funds do typically offer additional liquidity risk mitigants, namely notice periods –typically 30 days, on top of the stated redemption frequency. Given the potentially protracted settlement period on European loans – 10 days on average according to loan fund manager estimates – this is an important feature, but is not necessarily sufficient to stave off material liquidity issues in the event of market and redemption pressure on a fund. However, when funds sell loans they have the advantage of physically owning the loan already, which may enable shorter settlement times than when purchasing loans. The fact that the market may simply not trade represents a material liquidity threat to these funds, especially the larger ones and those with more concentrated investment strategies.
Funds have multiple liquidity management tools available: these can range from redemption delays to in-specie (or in-kind) redemptions in which a vertical slice of the portfolio is transferred to the exiting investor in lieu of cash and, in the most severe cases, gating, or closing the fund to redemption. The implementation of this last tool was brought into focus in the UK after the Brexit referendum in relation to commercial real estate (CRE) funds, which were forced to gate due to redemption risk relative to available liquidity (cash; see: Gating of UK Property Funds Flags Immediacy of CRE Risks). Whether these funds will successfully reopen remains to be seen; more importantly this event highlights the risk associated with the inclusion of illiquid assets in open-ended funds.
However, loan funds do have some important differences with CRE funds – they are more granular and buy syndicated exposures (rather than single properties). They also operate in a market dominated by a predictable, term-funded investor base: the CLOs, unlike the CRE funds, whose investor base includes institutional as well as retail investors. Due to portfolio construction parameters driven by liability ratings, CLOs have specific asset appetites, which can pose a powerful technical force in the loan market, supporting loan prices and affording both opportunities – and challenges – to loan funds. However, they also face similar issues in terms of transaction time to settlement and a market that is inherently less liquid than, for example, investment-grade credit.
Leverage Negligible in Loan Funds
Loan funds can engage in external leverage. This is commonplace in the US, where 1940 Act closed-end (loan) funds will routinely issue structural leverage into the market. However, the size of leverage is limited, averaging around 32% across the Fitch-rated portfolio, with a maximum level of 36%. In Europe practices vary; most funds are able to engage in leverage under their prospectuses but very few actually do so. This contrasts sharply with CLOs, which
will have leverage of 16-17x at the equity level. This can have a substantial effect on returns: whereas loan funds yielded 5%-6% gross as of June 2016, CLO equity returns could be substantially higher owing to the leverage effect.
Managing Loan Funds: Data and Information Barriers
Managing loan funds is comparable to managing other funds of less liquid assets in many ways. However, loan funds have two important differences: first, data are often of poor quality or not timely; and second, loan data is private.
The former manifests itself in both the mundane and the more serious. Accurate loan identifiers may not be available and reported data, including highly relevant points such as maturity dates may vary across information providers. This inevitably distracts fund managers from their portfolio management duties.
The latter is primarily a control issue. As loans are private, investors gain access to privileged, private information, such as monthly management accounts, which may not be available to holders of public securities (bonds). Where there are both public and private securities in a capital structure, investors can own both simultaneously. Most investors will choose to be either public or private on a given issuer and therefore avoid any compliance issue. For those that do not, the establishment of effective information barriers is essential to prevent insider trading. An
important mitigating factor is the (slow) progress toward a more public loan market in Europe.
Look-Through Approach for Loan Funds under Solvency II
Insurers Allocating to Loans
One of the drivers for growth in demand for loans has been from institutional investors such as insurers. The Goldman Sachs insurance CIO survey in 2015 found that just over half of insurers surveyed had large-cap loan exposure and on a net basis 15% planned to increase their exposure over the coming year. For middle-market loans the proportion seeking to expand exposure was even greater at 29%. BlackRock’s 2015 survey found a net 14% of survey participants planned to expand their loan (and CLO) allocation over the coming 12-24 months –although this expansion is much smaller than in other asset classes.
Loan Fund Capital Charges Potentially High
The standard formula under Solvency II calls for a look-through approach to underlying fund holdings, except where data on the underlying fund are unavailable. Where a look-through is not possible capital charges can be high: the standard charge for an alternative investment fund is 39% +/-10%.
Standard formula insurers will therefore look through loan funds to the credit quality and duration of the underlying securities. There are two positive factors for these funds here: first, loans are typically unrated (although Fitch can assign Credit Opinions to them) and therefore are treated as unrated exposures. Second, loans are floating rate and therefore duration tends to be low. However, capital charges can be different under an internal model-based approach.
Unrated Exposures Carry Lower Capital Charges
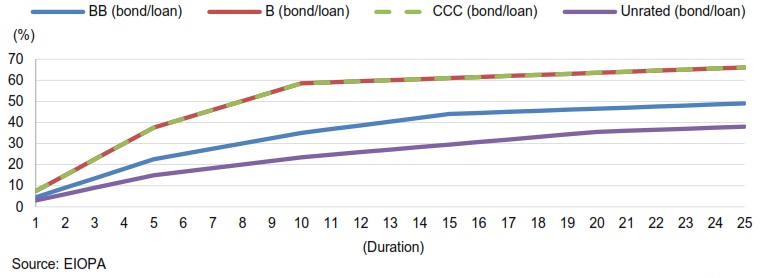
Assuming an effectively unrated loan fund portfolio with five-year duration, the capital charge would be 15%. In contrast, CLOs typically have duration of five years but due to the reinvestment period the weighted average life is longer at about eight years. In either case the applicable capital charge (five years: 62.5%; eight years: 100%) is significant as CLOs are considered Type 2 securitisations, which attract heavy capital charges. Even if rated at the ‘B’
or ‘CCC’ rating levels (which carry the same capital charges), the capital charge associated with a five-year duration loan fund portfolio (37.5%) would still be substantially lower than that of a ‘AAA’ CLO exposure.
ALL FITCH CREDIT RATINGS ARE SUBJECT TO CERTAIN LIMITATIONS AND DISCLAIMERS. PLEA SE READ THESE LIMITATIONS AND DISCLAIMERS BY FOLLOWING THIS LINK: HTTPS://FITCHRATINGS.COM/UNDERSTANDINGCREDITRATINGS. IN ADDITION, RATING DEFINITIONS AND THE TERMS OF USE OF SUCH RATINGS ARE AVAILABLE ON THE AGENCY’S PUBLIC WEB SITE AT WWW.FITCHRATINGS.COM. PUBLISHED RATINGS, CRITERIA, AND METHODOLOGIES ARE AVAILABLE FROM THIS SITE AT ALL TIMES. FITCH’S CODE OF CONDUCT, CONFIDENTIALITY, CONFLICTS OF INTEREST, AFFILIATE FIREWALL, COMPLIANCE, AND OTHER RELEVANT POLICIES AND PROCEDURES ARE ALSO AVAILABLE FROM THE CODE OF CONDUCT SECTION OF THIS SITE. FITCH MAY HAVE PROVIDED ANOTHER PERMISSIBLE SERVICE TO THE RATED ENTITY OR ITS RELATED THIRD PARTIES. DETAILS OF THIS SERVICE FOR RATINGS FOR WHICH THE LEAD ANALYST IS BASED IN AN EU-REGISTERED ENTITY CAN BE FOUND ON THE ENTITY SUMMARY PAGE FOR THIS ISSUER ON THE FITCH WEBSITE.
Copyright © 2016 by Fitch Ratings, Inc., Fitch Ratings Ltd. and its subsidiaries.
related articles: