By Simon Kerr, Hedge Fund Insight
When I received a manager monthly letter today showing four positive months for 2013 it made me wonder is that the manager or the strategy? After such a long time waiting, you will understand my interest, as the manager is a CTA.
The particular fund* has delivered a cumulative 7.52% in the YTD made up of 2.53% for January, 1.28% for February, 0.58% for March and 2.94% for last month.
To understand how the strategy is doing I started out by looking at returns on the IASG database of CTAs. Taking out those funds which are not systematic and diversified, and only looking at those with at least $100m in AUM, left a qualifying universe of 64 funds. 54 out of 64 have produced positive returns in the year to date, though only 26 of the 54 have provided April data. Amongst the top 10 CTAs ranked on YTD performance 7 have reported April returns, and six of those are positive. The overview of a large positive skew in YTD returns for CTAs is probably valid.
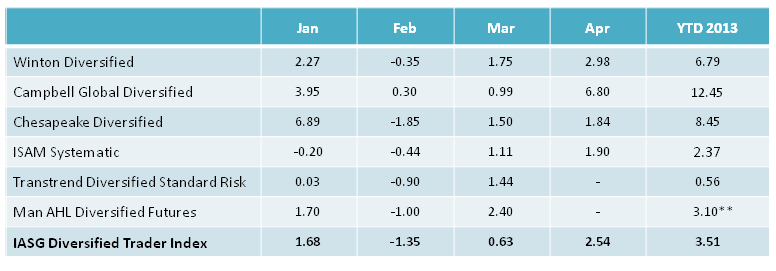
A few examples of return series from well known programs and a managed futures index:
 Sources: Hedge Fund Insight, IASG, managedfutures.com,manager letters
The IASG Diversified Trader Index looks a good proxy for the strategy on the basis of the data table above, and shows 3 out of 4 positive months this year.
Parenthetically, and given the focus on it, it is particularly noteworthy that the **Man AHL Diversified Futures Fund has had a spurt of strong performance since the end of the first quarter. The YTD returns to the 2nd May were 11.69%. It will have helped AHL that long-term trend following systems did well in April. For example, the medium-to-long term break down of gold was just the highest profile of some terrific shorting opportunities in the metals. The potential for a significant move in gold was covered here at the end of February (see http://www.hedgefundinsight.org/key-test-underway-for-gold/)
In the middle of last year, according to BarclayHedge, systematic CTAs had a total of $268 bn under management, which rose to $274 bn by the end of the 3Q 2012. By the close of the year systematic CTAs had slightly less under management ($266 bn) and diversified systematic managers, which constitute the core holdings of institutional investors, had suffered from redemptions in particular. As it is, in 2013 CTAs have put in their best performance streak since end-2008/early 2009, just after investors had begun to leave the strategy at the margin, proving once again how difficult it is time the allocations to the strategy.
*Capitrade CTA advised by the automated Systems team at CM Capital Markets

Not sure you answered your own question.
performance differentials in this strategy are due as much to sector exposures, time frame, position size, as skill.
recent out-performers in trend following have a higher weighting of equity indices, which has been the out-performer.
so strategy is doing better.
IASG Diversified Trader Index is not a good proxy…