
By Barclays Capital Solutions Group
The Equity Hedge Fund segment is obviously fairly broad and includes a set of disparate strategies. We have taken a close look at these various sub-strategies, which each have their own unique characteristics and appeal to investors. We describe these sub-strategies in this article and attempt to show their performance and net new flows.
Equity HF AUM split by strategy
Figure 1 shows that while Equity HFs overall have experienced AUM growth, the various sub-strategies within this segment have grown at different rates. As previously mentioned, the overall Equities AUM CAGR was 12% between 2008 – 1H14 but the underlying sub-strategies fall into three different AUM growth categories:
1. High growth: Activist and Multi-strategy
2. Moderate growth: Long / Short, Sector Focused, Market Neutral, and Event Driven
3. Slow growth: Quant
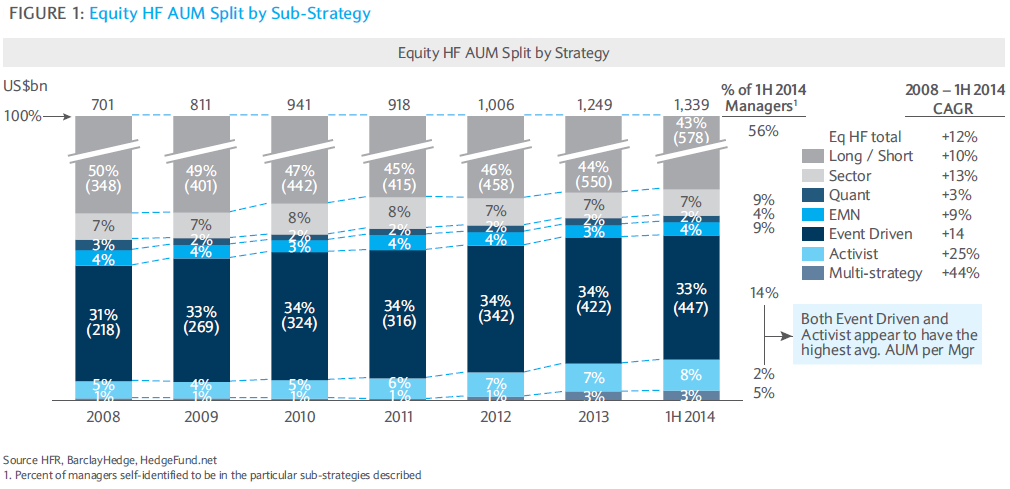
It is also interesting to note that only Activist and Event Driven HFs appear to have an average AUM that is greater than the overall average AUM for all Equity HFs.
Return and standard deviation by Equity HF sub-strategy
Figure 2 shows that Equity HF sub-strategies had varying level of losses in 2008 and have since had equally disparate levels of gains. For instance, Equity Market Neutral (EMN) and Quantitative Equity (Quant) experienced the smallest declines in 2008, but have had the lowest returns recently. The other sub-strategies each had steeper declines in 2008 and have seen varying levels of recovery since then, as Activist, Event Driven, and Sector Focused strategies have been well ahead of Fundamental Long/ Short and Multi-strategy, though recently these two sub-strategies have shown improved performance. It is worth pointing out that although the returns of the individual sub-strategies showed significant variation, from 2007 – 1Q14 each sub-strategy had a higher annualised growth rate than the S&P 500 (i.e., 4%) other than Quant, and from 2011 – 1Q14, each sub-strategy had a lower return (i.e., S&P 500 was 19.3%).
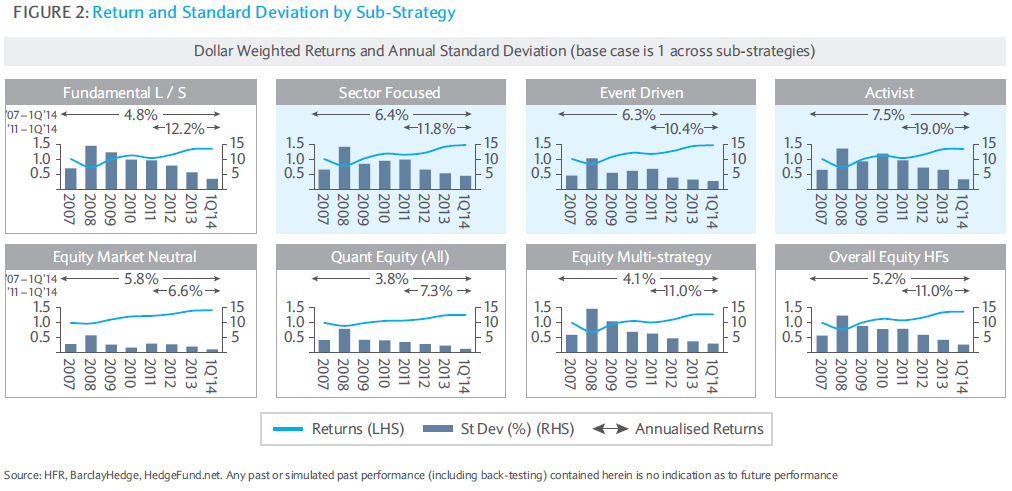
Similarly, the various sub-strategies’ annual standard deviations differed in absolute terms; however, the general direction has been the same across the board with consistent decreases since 2011. This is in line with the broader equity market, which has also seen lower volatility of returns.
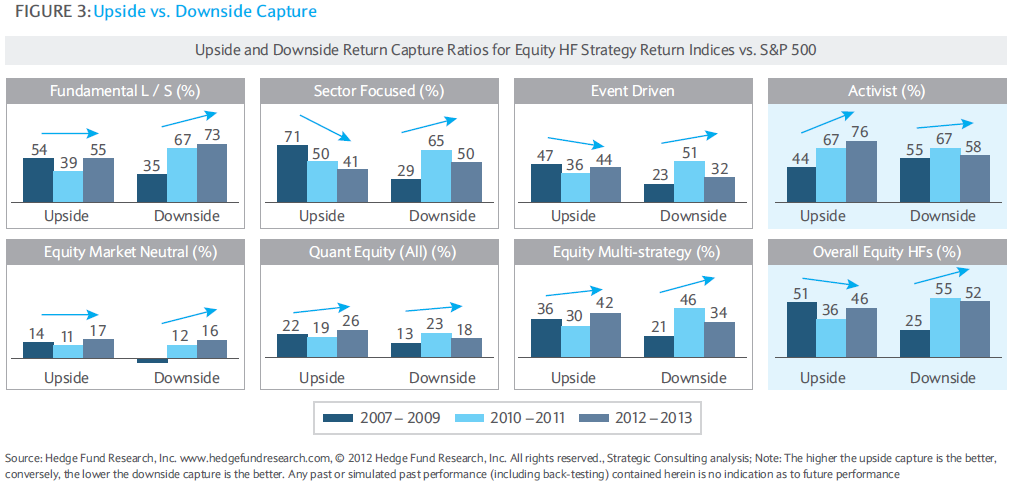
Upside vs. downside capture 1
Most Equity HF managers we spoke with indicated that they seek to capture somewhere between two-thirds and three-quarters of the upside and one-quarter to one-third of the downside of the S&P 500. However, according to HFR data, Equity HFs have been closer to 50:50 on both sides recently, as depicted in Figure 3. It appears that select Equity strategies have captured more of the upside relative to the S&P 500 recently (i.e., 2012 – 2013 versus 2007 – 2009), especially Activist strategies (improved by ~70%). However, each sub-strategy also captured more of the downside over the same time period, especially Long / Short where downside capture increased by over 100% – potentially due to macro factors, stock selection and / or market timing challenges. Some of the sub-strategies, such as Long/ Short, saw their 2012 – 2013 results improve significantly from 2010 – 2011, suggesting that they may be righting the ship. Event Driven and Activist also showed improvement as they exhibited the highest positive disparity between their upside and downside capture ratios.
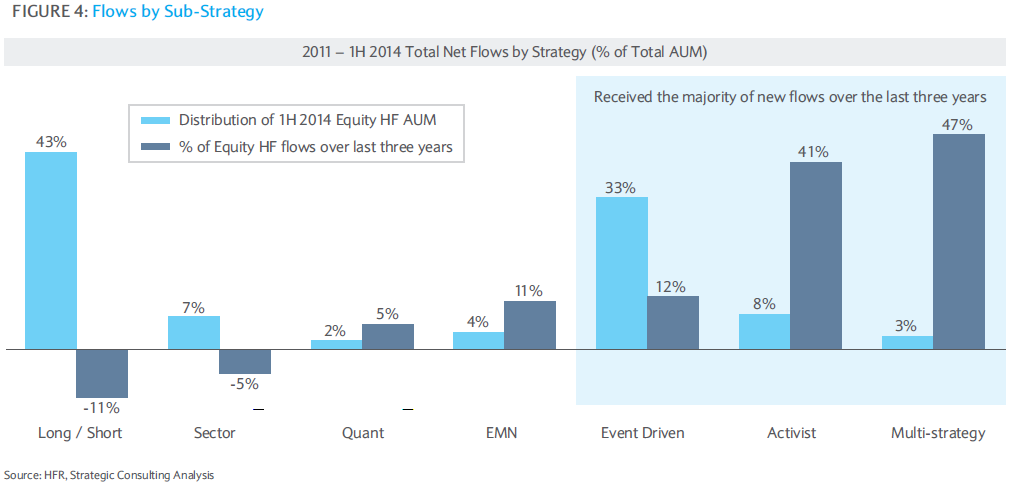
Comparison of flows to AUM by Equity HF sub-strategy
Obviously, investors did not allocate to various Equity HF strategies in a pro rata way over the last three years. As Figure 4 shows, Activist and Equity Multi-strategy HFs received a significant portion of recent net new flows (i.e., Activist HFs received 41% and Multi-strats received 47% of net new flows, respectively) despite collectively accounting for just over 10% of total Equity HF AUM. Activist, the strategy with the highest recent returns as described above, as well as Event Driven, which was the recipient of the third highest amount of net new flows, are strategies generally perceived as being less market dependent and more catalyst driven, which may explain why they were among the winners of net new flows. Investor sentiment may be changing though – Long / Short was the largest gainer in 1H14, winning ~33% of all net new flows to the Equity HF space.
This article is an extract from the 22-page report “Taking Stock – Recent Developments in the Equity Hedge Fund Landscape” from Barclays Prime Services, Capital Solutions
1 Upside/downside capture in a period is a measure of an investment’s compound return when the benchmark was up or down divided by the benchmark’s compound return when the benchmark was up or down, respectively.
One Response to “Analysis of Equity Hedge Sub-Strategies”
Read below or add a comment...