
By Ian Copsey of Harmonic Elliott Wave
For those who have not read my book, in July 2010 I forecast the DJIA, then around 9,500, to rally to the 12,800 area from where the Index would correct by around 20% before rallying to the 2007 high. This was not my final target. Indeed, this is still some way higher.
The purpose of this forecast, is to discuss the current situation. I shall provide charts and explanations for both the DOW and S&P. I am expecting an approximate 6% correction from current levels. This is based on both the structure and use of appropriate ratios that are the same across all wave degrees. Below is the daily chart of the DOW from the Wave (( B )) of Wave (( V )) (click on graphic to enlarge):
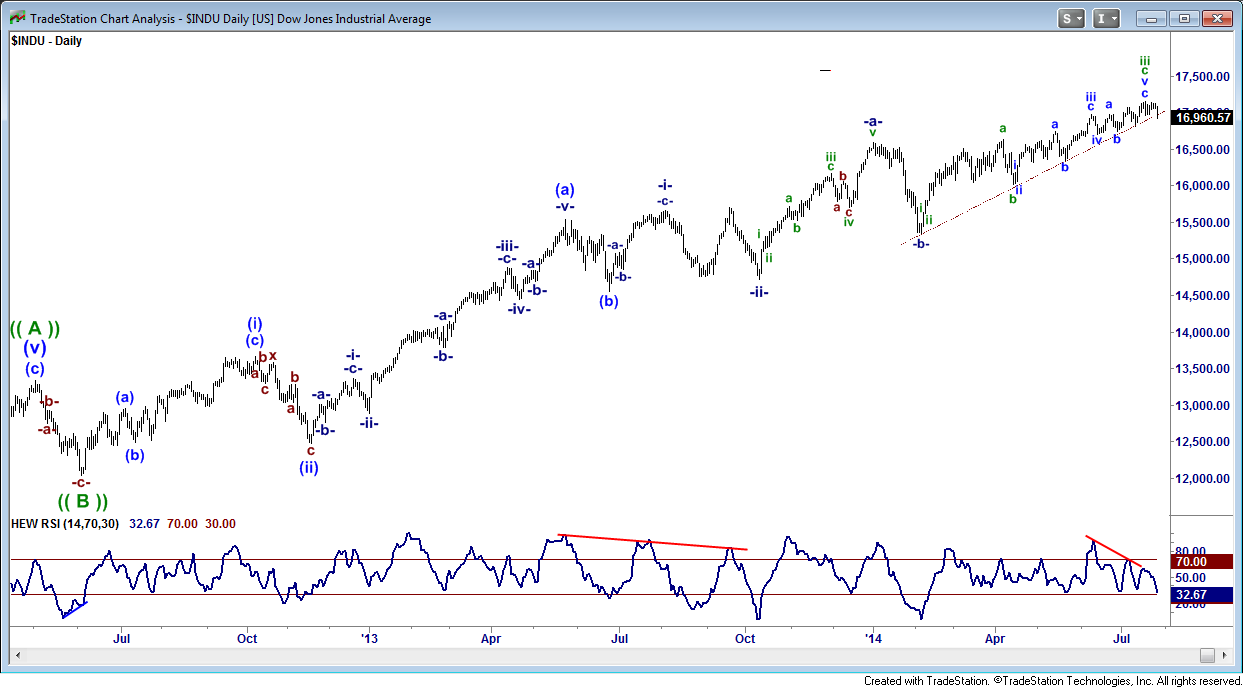
As a basic explanation of the methodology, Harmonic Elliott Wave utilizes a 3-wave process as opposed to 5-wave. This is where the wave relationships lie. Thus, the only waves that a 5-wave sequence will produce, is a Wave (a) or Wave (c). The Wave (i), Wave (iii) and Wave (v) are constructed of an (a)(b)(c) development. Wave (iii)’s must fall within standard projection clusters. The retracement ratios of the Wave (ii) and Wave (iv) are related – if Wave (ii) is deep then Wave (iv) will be shallow and vice versa. Wave (v) targets must match with the higher degree wave projection.
At this point in time price has just reached the 398.4% projection in the (green) Wave iii of (navy) Wave -c- / -iii-. The correction in (green) Wave ii was just 23.6%. This is very similar to the rally from the 2009 low that eventually reached the 12,800 high. As such, we should see a correction of around 58.6% implying this correction should reach the 16,261.97 area. It can be seen that the bullish trend line that originated from the Wave -b- / -iii- low has been penetrated and a double top seen in the hourly chart.
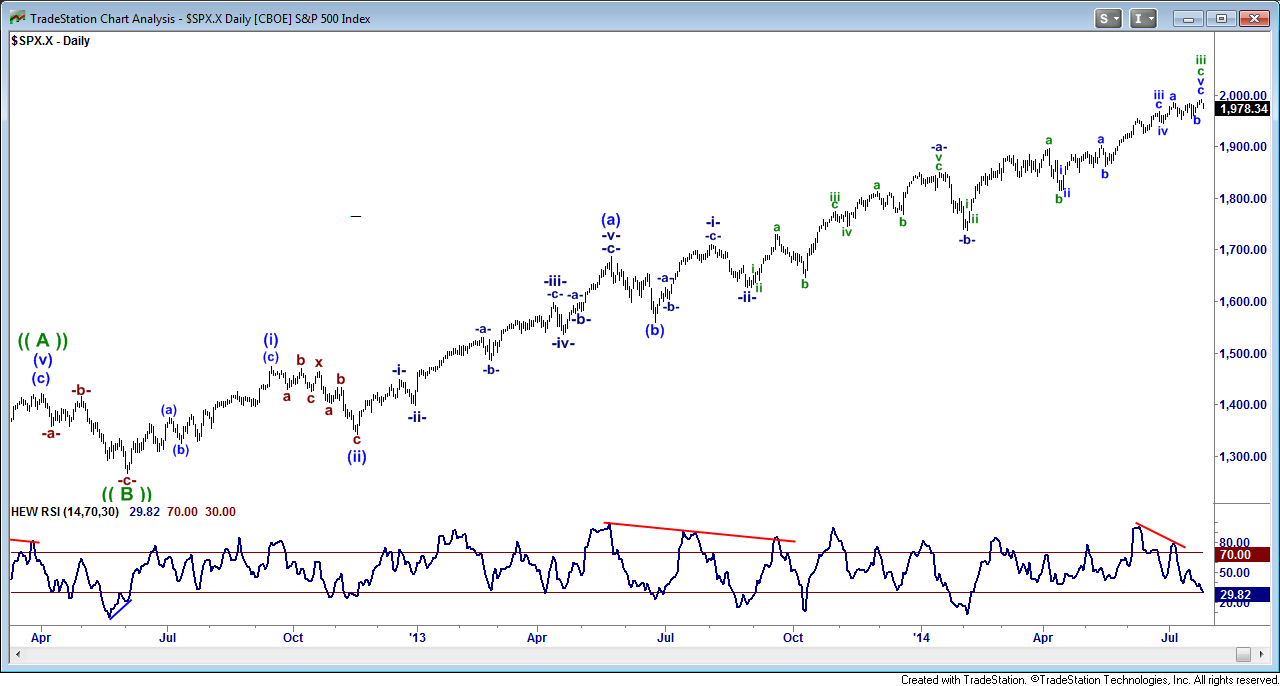
The S&P is in exactly the same section of the bullish wave count. The high at 1,991.38 was a 423.6% projection in (green) Wave iii. Equally, the Wave ii was just under 23.6% and thus the same 58.6% retracement area in Wave iv should imply losses to around 1,866.18.
Above is the hourly chart of the S&P 500 Index (click on graphic to enlarge). In Harmonic Elliott Wave, the first reversal after a high in a Wave v will be to the span of the Wave b of Wave v, and later to the most recent swing low. Basically the area between the Wave [iv] and the Wave ^a at 1,944.69 – 1,952.86 should be the next target.
Once the Wave (iv) in both the S&P and DOW are seen the uptrend should resume in 3-waves in Wave (v) towards the daily (navy) Wave -iii- targets.
For more information regarding the characteristics of Harmonic Elliott Wave and explanations of the various elements in the wave structure, please visit: http://harmonicelliottwave.blogspot.jp.
DISCLAIMER:
Harmonic Elliott Wave is not a signal system and should not be used as such. There can be multiple projection areas and therefore other techniques are required to fine-tune the eventual targets. The information is offered as an opinion on analysis methods and does not offer trading recommendations, investment advice or a solicitation or recommendation to establish market positions. The information provided should not be relied on as a substitute for extensive independent research before making trading or investment decisions. In addition any projections or views of the market provided may not prove to be accurate. The opinions are subject to change without notice. Ian Copsey will not be responsible for any losses incurred on investments made by readers and clients as a result of any information contained in this article.