
By Stan Altshuller, Co-founder and Chief Research Officer, and Brett Turenchalk, Analyst – Client Analytics of Novus Partners Inc.
Maverick Capital
The definition of entrenched, firmly established and unlikely to change, only partially applies to Maverick Capital. It is firmly established in the hedge fund industry as one of the oldest tiger cubs and commands roughly $10 billion in AUM. Its founder, Lee Ainslie, is just as established. He founded Maverick at 29 years old, lured away from Tiger Management and funded by the Wyly family office. He spent a handful of years at Tiger, brought on as a generalist and rising to lead the fund’s technology investments. He sits on the board of the Robin Hood Foundation among other well-known hedge fund managers.
But Maverick cannot be characterized as unlikely to change. Over the last few years, the hedge fund has made significant changes to its portfolio structure: increasing concentration and narrowing its focus on particular sectors and market caps. These are the likely cause of the fund’s recent outperformance.
Public Data
Everything mentioned in this article is sourced exclusively from public data, including the manager’s profile, simulated performance and all other analysis and commentary. The data used here omits the short side, non-equity securities, many non-US securities and all non-public information such as actual fund performance. To simulate performance and determine portfolio attributes such as liquidity, we combine public holdings data with market and pricing data and make simple assumptions.
Portfolio Concentration
In a November 2015 Pensions & Investments article, Mr. Ainslie noted the fund came to the “realization that Maverick’s portfolio was too diversified, which hurt performance”. This is a style divergence from the fund’s focus on concentration, which Mr. Ainslie described in an interview with McKinsey & Company, “On average, we hold fewer than five positions per investment professional—a ratio that is far lower than most hedge funds and even large mutual-fund complexes”.
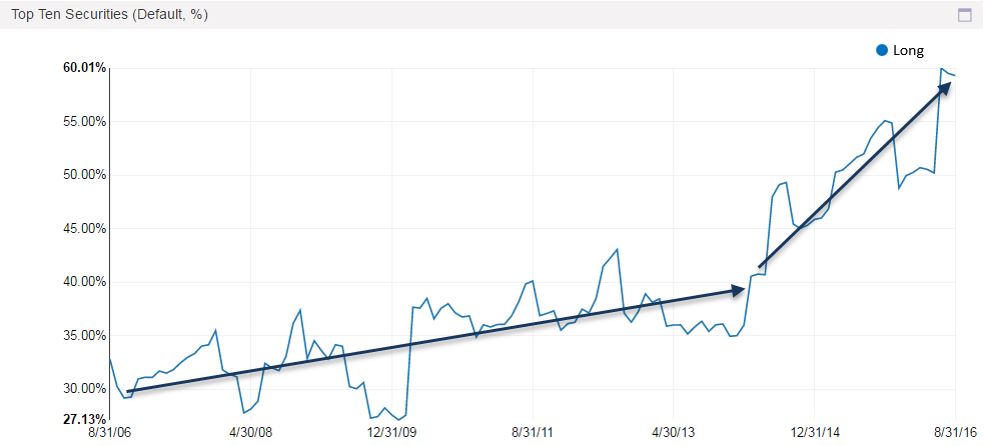
Since this introspective portfolio analysis, Maverick has embraced concentration. Concentration (top ten positions as a percent of the total portfolio) dramatically increased from 35% in early 2013 to its current level of 55-60%.
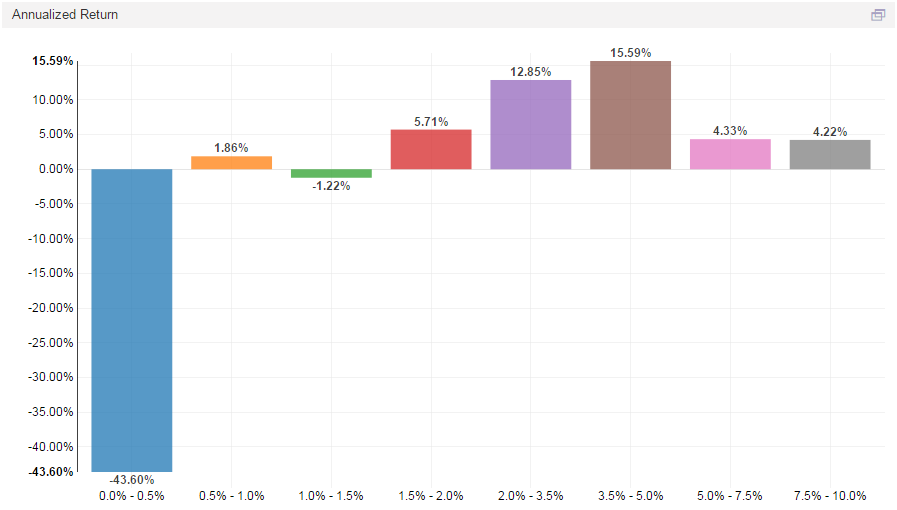
Has higher concentration rewarded Maverick? Yes – the annualized ROIC from January 2014 to August 2016 is higher in the larger position size buckets.
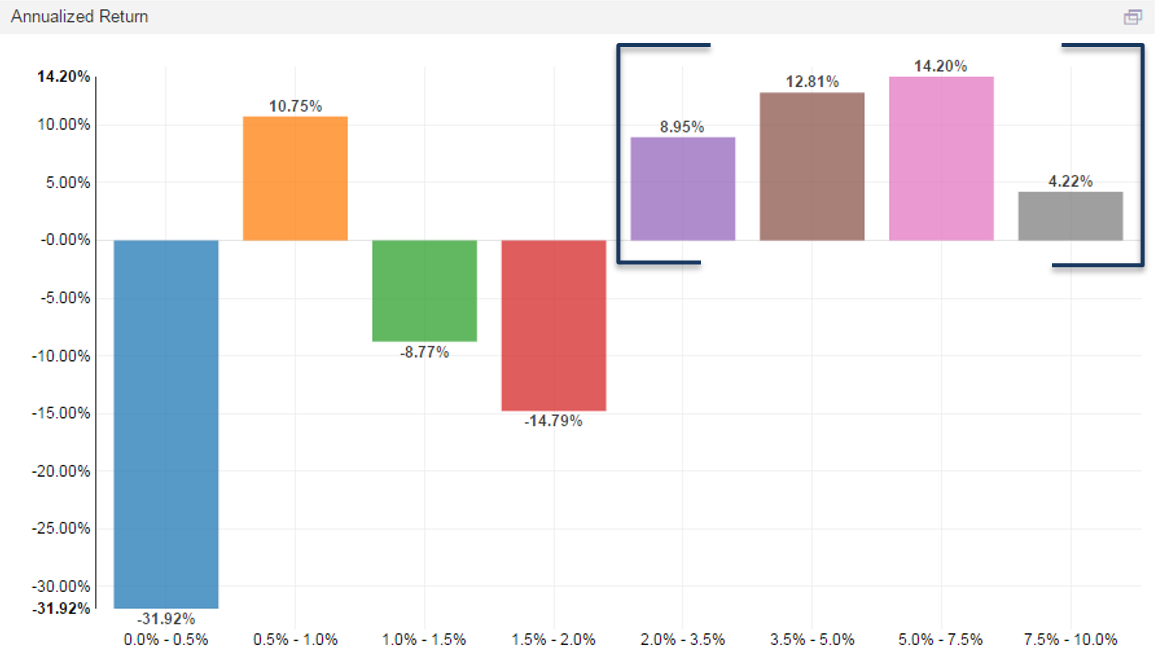
This conclusion holds true when we expand the date range to the entire public data set (March 2001 – August 2016):
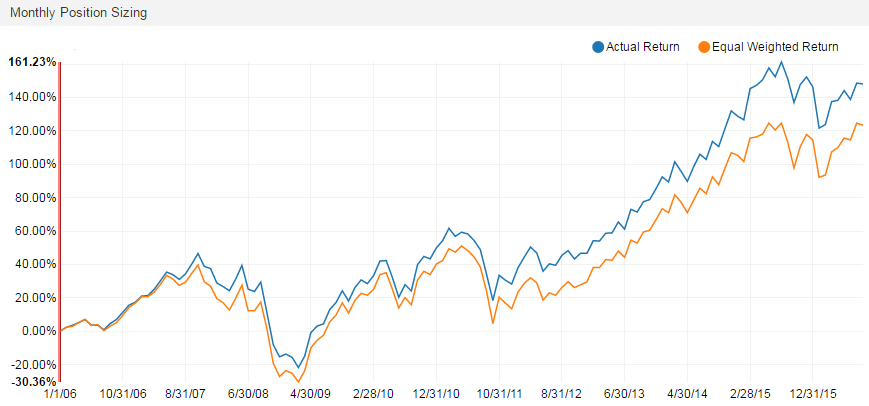
The chart below supports our theory on Maverick’s concentration (position sizing). We compare Maverick’s simulated performance to that of an equal weighted version of the fund’s portfolio and see the spread widening in the past two years.
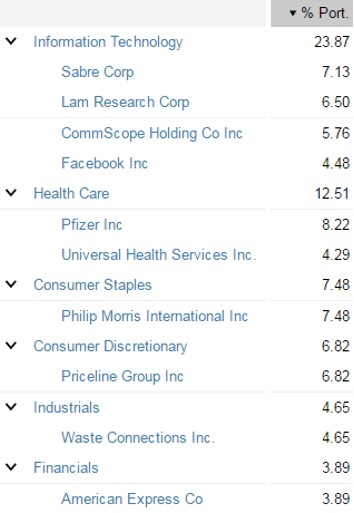
Here are the top ten positions in the portfolio from the Q2 public filings, grouped by sector, that are behind the concentration and sizing trends:
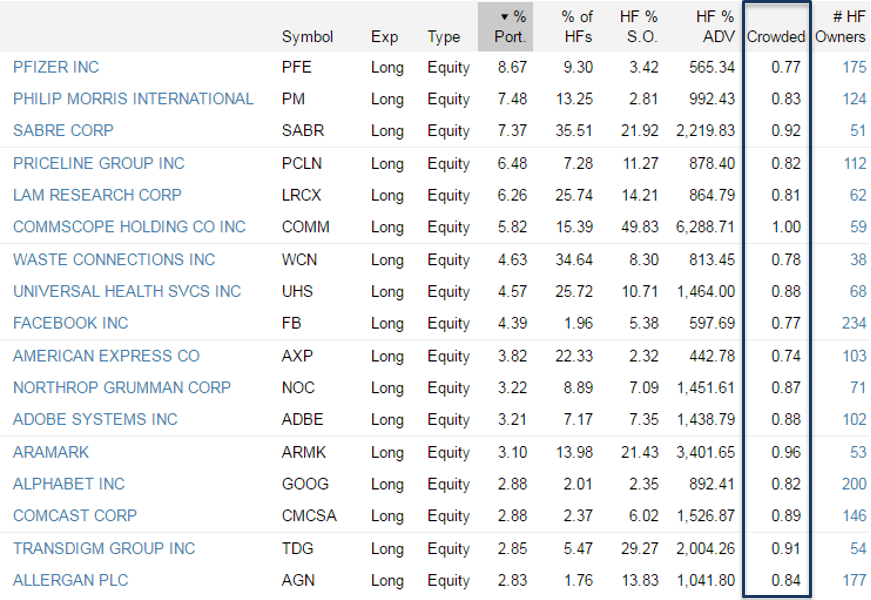
Hedge Fund Crowding
Concentration is an important internal metric to track during portfolio construction. Novus Research also stresses the importance of monitoring position crowdedness, an external risk factor. We calculate each security’s crowdedness score as a function of the percent of ADV the Novus Hedge Fund Universe owns and the number of hedge funds invested in the security. Maverick’s largest positions carry high crowdedness scores, which warn us of the potential for a drawdown to be amplified if crowd selling occurs.
Narrowing Sector Focus
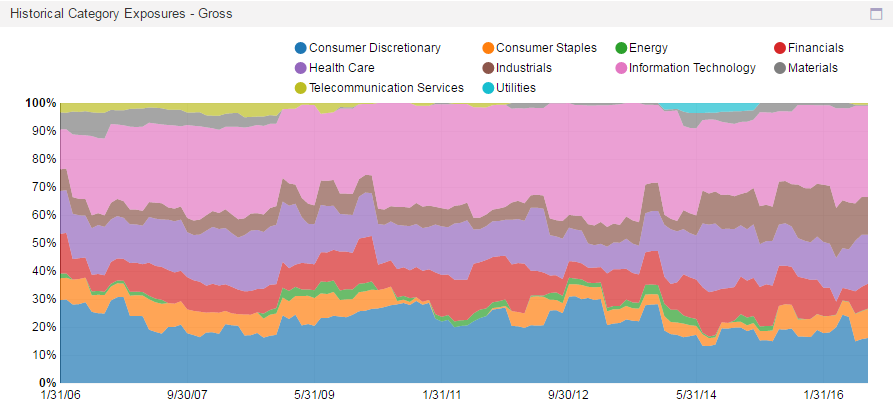
In addition to concentration, Maverick is focusing on its core sectors: IT, Discretionary, Health Care, Industrials, and Financials. It has all but exited Telecom, Energy, and Materials.
Success in Mega and Large Cap Stocks
Since 2010, the fund has reduced its exposure to small and micro-cap companies and now has near zero exposure to those buckets. In tandem, we see increasing exposure to large and mega-cap companies.
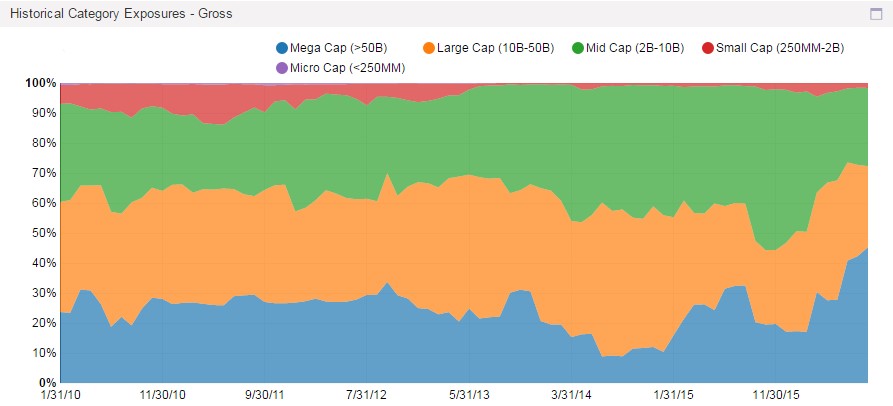
This shift will likely improve performance. The fund produced higher returns in mega and large-cap companies, in contrast to small and micro-cap names. As we move across market-cap buckets, the ROIC trend is clearly linear.
Conclusion
Concentration is the likely driver of Maverick’s strong simulated long performance. The fund has sized up its highest conviction trades, with over 50% of capital allocated to the top ten positions. It is focusing on core sectors, and is redistributing capital to the market cap buckets where it’s historically had success. Crowdedness is a significant risk factor for Maverick’s positions, which are frequently traded by its hedge fund peers, and must be carefully managed going forward.
EDITORS ADDENDUM
There is collateral support for the improvement in returns derived from increasing portfolio concentration in the longs at Maverick in the returns of one of Maverick’s funds.The Maverick Long Enhanced Fund is a balanced portfolio of long and short equity positions in each region and industry – primarily medium to large cap equities. It has a target of 100% net long exposure, 160% gross exposure, and the portfolio is re-balanced to targets semi-monthly or if the net exposure exceeds target by +/-5%. Since the increase in position sizing at the top end (dating from January 2014) the returns of the Maverick Long Enhanced Fund were 13.39% in 2014 and 3.68% in 2015. Year-to-date in 2016 the Fund was down 1.84% as at the end of July. Long/Short equity hedge funds were down 1.44% over the same period according to Eurekahedge.
Special thanks go to Novus Partners for updating their analysis to include the most recent data available specifically for Hedge Fund Insight readers. To see the rest of the Novus research library go to:https://www.novus.com/research-library/