
From Lyxor Asset Management
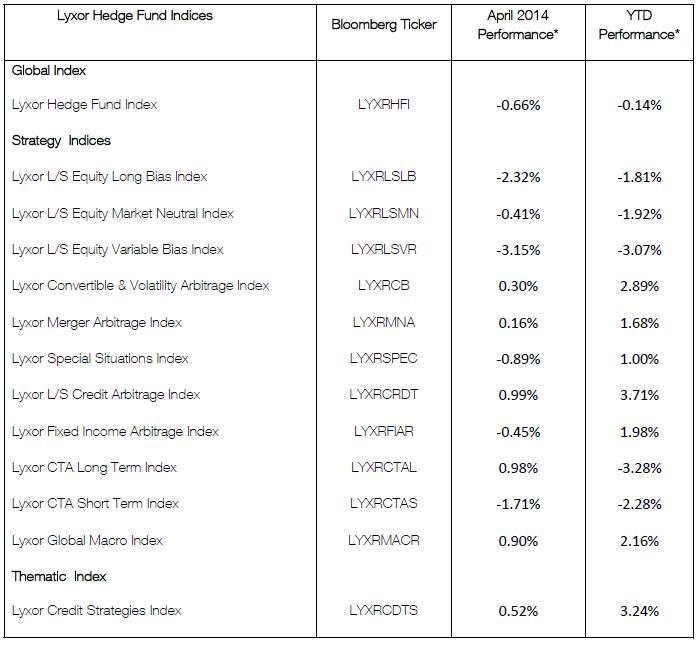
The Lyxor Hedge ![]() Fund Index was down -0.7% in April (YTD -0.1%). 6 out of 12 Lyxor Indices ended the month of April in positive territory, led by the Lyxor L/S Credit Arbitrage Index(+1%), the CTA Long Term Index (+1%) and the Lyxor Global Macro Index (+0.9%).
Fund Index was down -0.7% in April (YTD -0.1%). 6 out of 12 Lyxor Indices ended the month of April in positive territory, led by the Lyxor L/S Credit Arbitrage Index(+1%), the CTA Long Term Index (+1%) and the Lyxor Global Macro Index (+0.9%).
Data published in April did not alter the macro picture of major economies, that of a low inflation and modest but firming growth. Amid tight market trading range, falling cross asset volatilities, and without clear catalyst, a US equity sector rotation upset traditional hedged equity approaches, in style, in size, and in momentum. Strategies most exposed to these approaches and to short-term market reversals suffered the most: L/S equity and short-term CTAs. Meanwhile, strategies focusing on credit and macro themes profited from continued carry chase and central banks developments.
L/S Equity funds were down, with significant dispersion. An equity rotation came with a vengeance on a selected number of US sub-sectors including Internet, Biotech, and growth small caps. Stretched valuation, crowdedness – in particular from hedge fund managers – and unexpected global liquidity flows were probable catalysts. The rotation unsettled equity hedged approaches widely implemented by L/S equity managers. In particular Pairwise hedged, Systematic or Growth oriented types of funds were caught in a double whammy. The variable bias underperformed long bias funds, but their average performance actually mainly results from 3 funds heavily exposed to ultragrowth stocks. The rotation was mainly observed in the US, with limited spill over to other regions. In Europe, the ebb and flow of the geopolitical risk made market timing challenging. Interestingly managers maintained the bulk of their positions over the period. Long biased funds kept their gross and net exposure unchanged at 160% and 85% respectively. Variable biased funds held a 35% net exposure. Funds which were hit the hardest in April recouped only part of their losses by month-end: in the absence of an equity rotation capitulation, main losers didn’t materially rebound.
As investors struggled to understand the causes of and implications from the equity rotation, risk aversion spread to event driven positions. Merger spreads widened before normalizing by month-end. Bidding wars in key recent jumbo deals allowed merger funds to cope well, and finish the month up +0.2%. Special situation funds were down -0.9% on average. They hold significant stakes in communication and other cyclical & growth oriented sectors. These positions suffered in the early part of the month before rebounding thereafter.
On average, Lyxor’s event driven funds hold a 12% net exposure on communication, 11% on Financials, 10% in Consumer non-cyclical, 8% on Consumer cyclical. They marginally reduced the overall net exposure down to 50% by cutting their long positions, in particular among consumer cyclical stocks. Distressed funds, more heavily allocated to US credit, and less exposed to the growth sectors, fared decently. They also profited from a distribution on Lehman claims.
The equity exposure held by long-term CTAs models has increased the volatility of their returns. Losses in the early part of April were recouped by month-end. They were up +1%. Short term CTAs incurred severe losses in the second week, but haven’t regained the lost ground: their exposures were switched prior to the market rebound. On average, most CTAs funds lost on equities and USD during the market turmoil, but recorded positive contribution from commodities and rates.
Global macro funds were up +1.3% in April. They successfully played the dovish rhetoric competition among G3 central banks and the relative economic momentum turning in the favour of Europe and UK. They were also adequately positioned on commodities. They end the month with significant gross exposure, displaying allocation to ST rates and FX significantly larger than historical averages -a sign that their universe of opportunities is widening.
L/S Credit funds were the best performers in April. While HY slightly underperformed IG, the asset class remained largely isolated from equities’ turbulences. Lyxor’s credit funds profited from further credit tightening in EU periphery and made some gains in EM debt. Convertible arbitrage funds mitigated delta losses thanks to their credit exposure and gamma trading. They also continued to enjoy healthy primary markets. Their significant stakes in Energy and Financial contributed to offset losses in other sectors. Credit funds then fully profited from the month-end market rebound, both in cash and derivatives. On average, they hold a 60% net exposure with a 280% gross exposure.
Diversification among hedge fund strategies have so far allowed to wave through the succession of risks which have emerged year to date. Still the full potential from the current macro and micro themes has yet to unfold. “Clearer economic prospects in H2 should provide some base for firmer trends in risky assets. In the meantime continued range bound trading is the most probable scenario, which should cap allocation returns”, says Jeanne Asseraf-Bitton, Global Head of Cross Asset Research at Lyxor AM.
Lyxor Hedge Fund Indices
Leveraging on the breadth and diversification of the Lyxor Managed Account Platform, the Index performance aims to be the most representative of the hedge fund industry. The Lyxor Hedge Indices are composed of funds selected by Lyxor Asset Management, available on its leading Managed Account Platform that covers all the major hedge fund strategies and benefits from a high level of transparency and risk control, while ensuring weekly liquidity. These Indices are investable, asset-weighted indices, designed to offer investors straightforward access to hedge fund performance. The Lyxor Hedge Fund Index range comprises 15 indices from global to mono-strategy or thematic indices. The Lyxor Hedge Fund Index (Global Index) reflects the average performance of all 13 strategy indices, thereby offering direct exposure to the global hedge fund universe.
(*) MTD returns are based on performance from the last estimated NAV of the previous month until the last estimated NAV of the reported month. YTD returns are from December 31st, 2013 through April 30th, 2014.