
By Karim N. Taleb, Ph.D.,Managing Partner of Robust Methods LLC
Those familiar with Robust Methods’ financial analysis and views, know us as no strangers to the commodities markets in general, and the monetary metals in particular. The founder of the firm has been an advocate of the metals since the early days of that bull, and going as far back as gold at under 300 dollars an ounce. With the yellow metal currently flirting with the 1300 dollars handle, and the Fed promising to raise rates, some may see that bull as growing old, or about to stumble.
Not so fast! It is still a puppy, and though the wait feels awfully long, it has been an over-extended warm-up before we get sprinting. In our recent communication to clients, we noted how analyzing today’s markets has become an exercise in futility since the start of Quantitative Easing by the central banks, and even more so given the central banks’ ongoing changes and tweaking of their narrative.
Needless to say, the credibility of the central banks has never been despicably lower since their inception. Given the deep distortions that they have created, the 24×7 manipulation of most major markets, and the rampant systemic fraud, logic and reason are left behind; a serious market observer is left with few words to say. Yet there is a catch. And to those Biblically inclined: Be not deceived; gold is not mocked!1
In this article, we take a closer look at the gold market, known over the ages to show up as the last asset that saves the day.
It is the unimpeachable noble metal that remains standing, unphased, when all other assets are being decapitated. What about stocks, ‘ten baggers’, and Peter Lynch? These are to acquiesce to the backstage. The chart below shows the price of gold, the S&P 500 index, and their relative ratio.
According to the mainstream financial media, we’re supposedly living in a ‘brave new world’ – or is it so? A re-run of the Nasdaq crash of 2000 may appear too far-fetched in such a case. Past the fears of the Y2K transition at the turn of the century, or having survived at least a series of explosive crises, ranging from Bear Stearns, to Lehmans, to MF Global, to Madoff, or JP Morgan’s London Whale, all the above added to a list of banking failures, market flashcrashes, and counting, it may not be a bad idea at all to examine what has transpired over the past 15+ years. Such events remain very relevant to today’s markets, and may well hold the key of what’s about to unfold from here.
We review history, inspect any holes in the hull, and act accordingly to set a safe sailing course to our ship. Back in the mid to late 1990’s, when the dot-com bubble was being pumped with steam, Alan Greenspan thought it wise to raise rates, puncturing the balloon, and provoking the great Nasdaq crash of 2000 that sent the markets reeling. Hearing the sucking sound shortly after, and realizing his big mistake, the Fed’s Chairman reversed his tightening policy; he started dropping rates furiously, deep into negative territory (real rates), in order to provide some crash landing padding to the Nasdaq.
The M.I.A. (missing in in action) part is the fact that the Federal Reserve is clearly unable to forecast the business cycle, let alone moderate it.2
This means that the Fed is consequently unable to meet its primary stated mandates of maintaining price stability and economic growth. Practically speaking, the central bank has been engaging in deliberate ‘False and Misleading Advertising’ since its inception in 1913. There is a law in the United States for that matter, and which punishes the offender, and with justice remaining to be seen on that front.
Having kept interest rates below the inflation rate, and well below the required interest rates of savers and investors, it is no surprise that the stock market became speculative and formed a bubble in the mid to late 1990’s. With real rates set at a negative level, or where saving accounts are forced to pay the banks, instead of being compensated for lending their money, while also taking risk through putting money on deposit with banks, we see how the price of gold in dollar terms has started its march upwards soon after the turn of the century.
Coming back to Greenspan’s Fed, and seeing a new real estate bubble starting to form as a result of the previous sharp U-turn in rates (see above), and while not over his mistake of being too late to tighten in the late 1990’s, Greenspan started to raise rates more aggressively as of mid 2004.
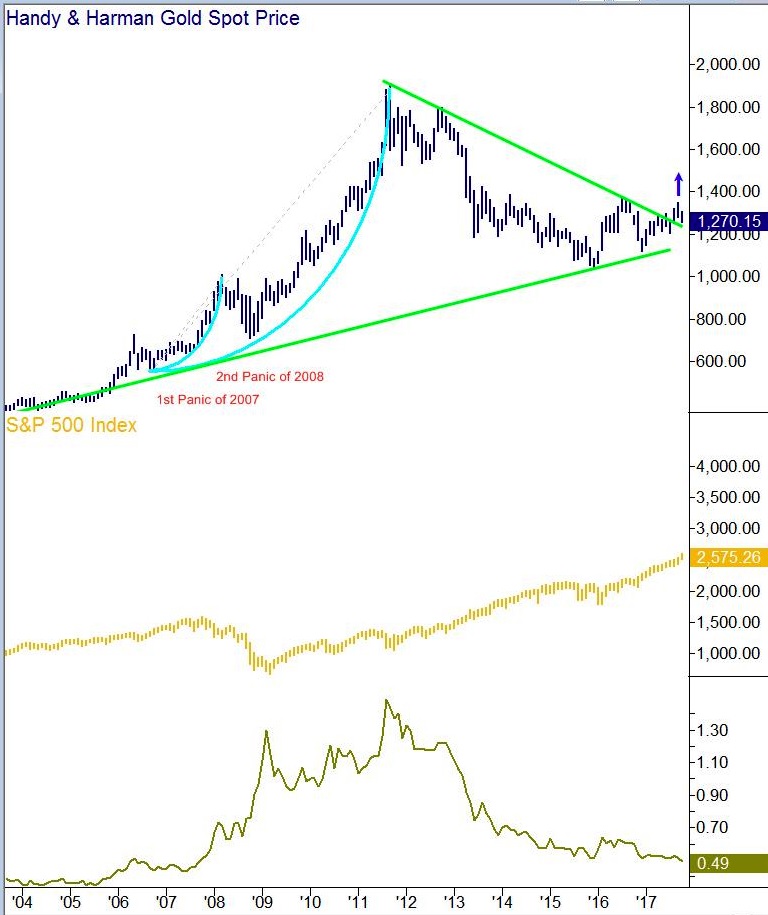
Yet the Fed’s Chairman proved to be behind the curve once again, while thinking to be ahead of it! His aggressive, albeit late tightening, precipitated a ‘credit crunch’ this time around, which started with the ‘sub-prime crisis’ and failure of Northern Rock bank. During that 2007 to 2008 period, gold swiftly reflected the profound central banking problems and shot up. It can be seen in the chart above as the cyan arc showing a first acceleration in the price
of gold.
The sub-prime crisis of 2007 was soon followed by a much broader mortgage crisis in 2008, and which acted like jet fuel to the price of gold and silver, taking them both on an accelerated ride upwards, and that would last a few years (see the second cyan arc in the chart).
It was then that the central bankers hit the panic button, and started an orchestrated campaign to totally squash the dollar price of gold. The fear at the central banks was real.
Anybody who understands the details of the central banking shenanigans, understands how a rising price of gold is a central bank’s enemy extraordinaire.
Yet despite the massive and repeated suppression of the price of gold over the recent years, the metal has held well above its uptrend (bottom green line), and continues its march upwards unabated. Better, and after a roller coaster of ten years, it managed to break out upwards of a nice triangular formation.
Such a breakout is significant, and invites the ship to new waters, where less resistance is likely to be found – or at least barring new interventions and more gold dumping by the central banks. From a relative valuation viewpoint, the 3rd plot at the bottom of the chart shows the ratio of gold to the S&P sitting at a reasonably low level. It implies that gold is undervalued compared to equities.
The total of the above observations put together, gold seems well positioned to remain on course in
its long term march upwards.
We now take a look at the ‘Gold Bugs Index’, or the un-hedged miners index on the next page, notorious nowadays for having cost money to many investors’ over the recent years. Blame the Fed and Western Central Banks, over and over!
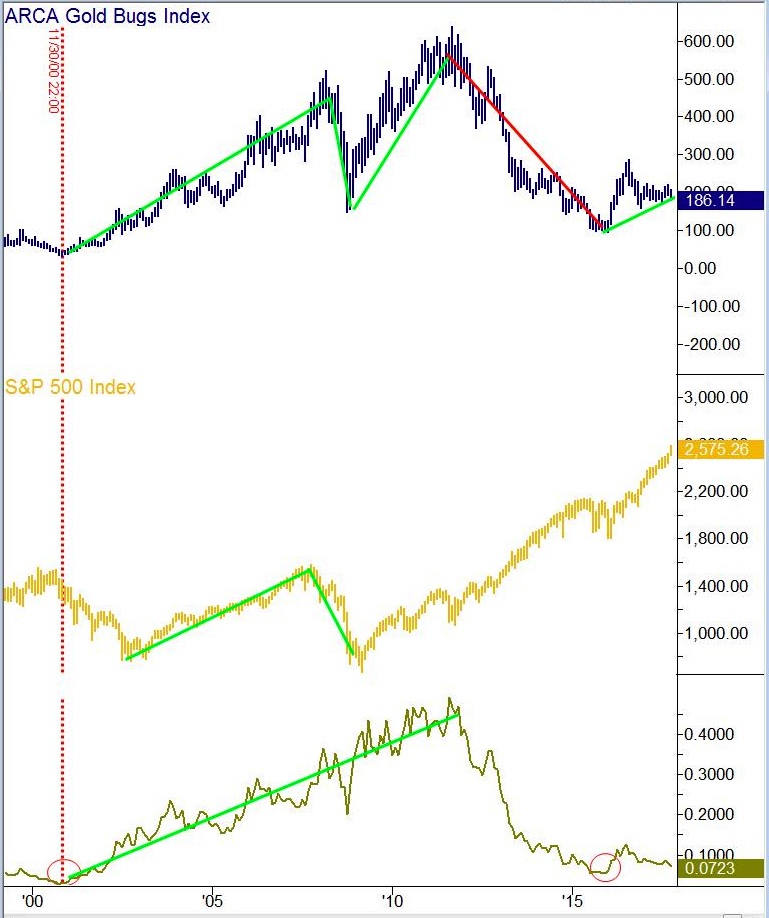
While the miners equity index has more or less tracked the broader equity index as illustrated by the S&P 500, there is a marked de-coupling that started with the orchestrated take down of gold and silver as of 2011. The red line on the chart shows how the index took a dive down, while the S&P 500 continued to rise as if set on auto-pilot – and feel free to drop the ‘as if’ if you prefer.
Six years past 2011, now in 2017, this divergence has gone to such an extreme that the ratio of the miners index to the S&P 500 is sitting at an extreme low as can be seen at the bottom of the chart. The miners index hence resembles a compressed coil waiting to be released, or unless one believes that the index at its current level is already discounting a much lower gold price in the future.
Yet as we see in the chart above, the technicals pointing upwards on gold are well supported, and despite its pervasive price suppression by the central planners. The fact that gold still manages to have positive technicals could be an early indicator that the manipulators are running out of ammunition, and are unable to push it down any lower without losing a substantial quantity of physical gold – something they’d think twice and thrice about.
That said, and should the spot price of gold push further upwards from here, the gold stocks have a huge gap to fill and plenty of lost ground to recapture; their value can easily multiply several folds in no time.
Going back to the macro view, and as we’ve shared with our clients over the years, the current financial system cannot continue much longer in its current form as it never had a good foundation to begin with. We gather and process a significant amount of data on a daily basis, and look as far back in market history as possible. The problem is not about market abuse, occasional interventions, or excesses coming from the central planners. We are talking about fundamental flaws at the core of the system, and which can only finish badly.
The financial markets and highly financialized economies of the world continue to drift like rudderless ships in a field of floating icebergs. The day of their destiny is anybody’s call, but we already know how this scenario usually ends.
All our analyses continue to validate our thesis, and in fact, strengthen the case for a robust portfolio management approach. Be it gold or silver, both are coiled springs with explosive potential, with the show about to begin soon. When all is said and done, we trust that the precious metals will play a key role in exposing the central planners as naked, and in reclaiming their role once again, as corner stones to a sound financial system.
_________________
1 Original source: “Be not deceived; God is not mocked: for whatsoever a man sows, that shall he also reap.”,
The Holy Bible
2 Greenspan admitted later on that he is unable to tell whether the market had expanded into a bubble
or not.
© Robust Methods LLC. All Rights Reserved.