
By Hedge Fund Insight staff
The Rock Creek Group is a leading global investment and advisory firm with approximately $10 billion in
invested and committed assets under management. Members of the Rock Creek team have been investing globally in hedge funds and emerging markets since the early 1990s. In previous careers at the World Bank, Rock Creek principals managed up to $110 billion in multi-asset-class portfolios for an institutional client base.
The Washington-based firm implements a multi-dimensional process to manage funds of hedge funds that combine strategies and managers into portfolios for investing institutions and, more recently, for a liquid alternative mutual fund.
It is difficult for a fund of funds to separate themselves from the competition in what they do. The core tasks are common across the industry. In the case of The Rock Creek Group they claim five differentiators. Three of these claims relate to their staff – a stable team, “unsurpassed” expertise in that team, and diversity amongst the staff by language and background. The fourth difference from their hedge fund selecting peer group is in its size – at $10bn large enough to provide institutional-quality resources and systems and small enough to invest nimbly. That leaves the fifth differentiator, which will be discussed here, a five-dimensional view of portfolio management.
Transforming data into information in portfolio construction
The Rock Creek Group says that the first three tasks of running a fund of hedge funds are strategy selection, due diligence and manager selection. The next step is a more complex challenge according to Rock Creek: combining strategies and managers in a way that produces a robust portfolio. This task involves not only setting strategic allocations but also dynamically changing tactical manager weightings to take advantage of current opportunities.
Portfolio construction is the crux of Rock Creek’s investment approach. The investment process is designed to elucidate the many complex factors affecting portfolio returns and take them into account when constructing portfolios. The multi-manager advisor, under senior managing director Sudhir Krishnamurthi, gathers what they describe as “enormous volumes of data” and transform it into information that can be used to build portfolios.
An example of the quantitative analysis undertaken is the stress testing conducted on existing and potential portfolio combinations. This process uses the historical data on manager performance, overlaid with Rock Creek’s outlook on global economies and markets. The tests project how individual managers are likely to perform in the anticipated environment and in a variety of alternative scenarios, as well as the impact their performance would have on a variety of risk and return characteristics for the portfolio as a whole.
Performing this analysis consistently over time is thought to strengthen Rock Creek’s understanding of the relationships between managers’ performance in a wide variety of environments, potentially giving the firm what they describe as “an ever more nuanced and sophisticated view on portfolio construction.” All discussions about portfolio positioning include professionals from the risk team to ensure that any changes align with the portfolio’s objectives.
A key method that The Rock Creek Group uses to transform data into usable information is the visualization tool that will be covered next.
A five-dimensional view of portfolio management
Rock Creek evaluates strategies and managers using advanced, one-of-a-kind analytic tools. The team can visualize multiple dimensions of performance simultaneously, including risk, return, and sensitivity to specific factors over time—giving deep insight into the diversification of their overall portfolio.
The multi-manager from the American capital has invested heavily in systems and technological tools that support the manager evaluation and portfolio construction processes. These tools, amongst other things, allow the Rock Creek investment staff to evaluate strategies in multiple ways – help them see things that other managers do not.
Constructing a portfolio of multiple strategies and managers involves assimilating and analyzing an almost incomprehensibly large volume of data. Rock Creek has invested heavily in systems that support the manager evaluation and portfolio construction processes. The firm uses technological tools to present these data in ways that can inform portfolio management decisions. It should be emphasised that the tools are integral elements in the investment process and not a component of a marketing paint-job.
One such system is the Rock Creek Visualization Tool, which the team uses to evaluate the performance of specific managers and combinations of managers over time and in specific scenarios. It enables the portfolio management staff to consider as many as five dimensions of performance simultaneously—giving the insight needed to build portfolios.
The charts below show a simplified version of the tool.
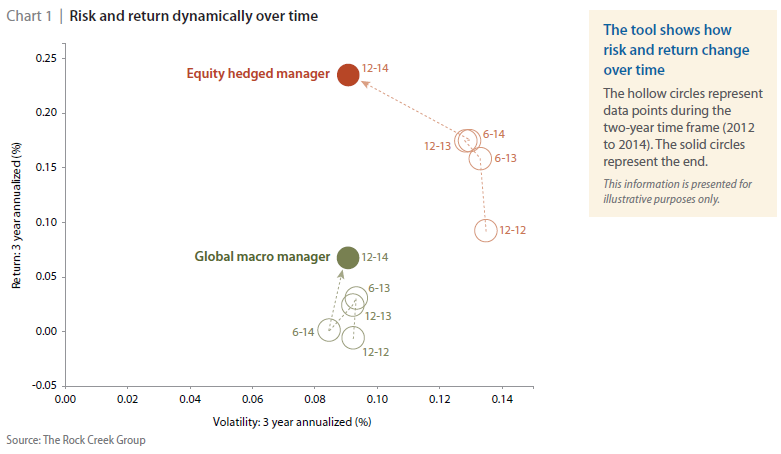
The bubbles represent an equity hedged manager and a global macro manager. This chart displays data about these managers in four dimensions:
■ Volatility (the x-axis)
■ Extreme expected shortfall (bubble colour; red indicates greater shortfall risk, green indicates lower shortfall risk)
■ Time (from December 2012 through December 2014)
Throughout much of the period, the equity hedged manager had greater return, volatility, and shortfall risk than the global macro manager. Late in the period, the equity hedged manager’s volatility and shortfall risk declined dramatically.
The following version of the same chart adds a fifth dimension: bubble size, which in this case represents sensitivity to the commodity super-cycle (demand for commodities driven by China’s economic growth). The larger the bubble, the more likely the strategy is to benefit from the super-cycle or be hurt by its absence.
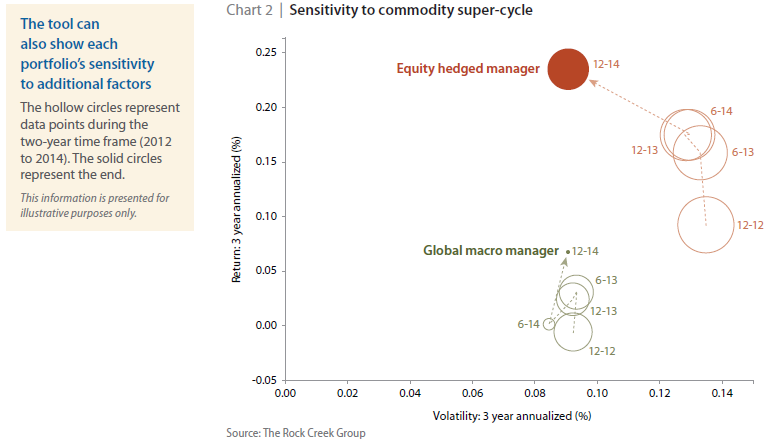
The addition of the fifth dimension illustrates how Rock Creek can apply its economic and market outlook. In this case, the equity hedged manager maintained a strong sensitivity to the commodity super-cycle, while the global macro manager’s sensitivity declined. If Rock Creek’s outlook called for the super-cycle to strengthen, this insight might lead the hedge fund advisor to consider a tactical overweight to the equity hedged manager (assuming that the fund of funds manager believed the portfolio will retain that sensitivity). Conversely, an outlook calling for the super-cycle to wane would strengthen the case for favouring the global macro manager.
The final version of the tool (chart 3) adds a bubble representing a portfolio with equal allocations to the two managers. It demonstrates the ways that the two managers’ returns, volatility, shortfall risk, and sensitivity to the commodity super-cycle evolved in the past—and, most important, the ways those characteristics evolved for the overall portfolio.
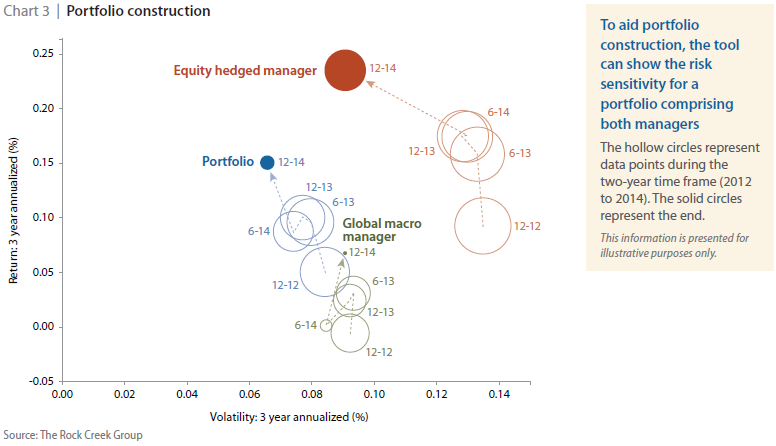
The resulting chart displays the benefit of diversification: The combined portfolio carries less volatility and shortfall risk than either manager on a stand-alone basis for the period under review, with a greater return than the global macro manager.
Again, this is a radically simplified version of the chart that is used to evaluate portfolios. The full version would include all underlying portfolios (typically between 7 and 14). Moreover, the investment team can adjust the x-axis, y-axis, bubble size, and colour to represent any of dozens of variables and overlays, making the tool exceptionally flexible.
Rock Greek Group say that trying to interpret the individual data points without this tool would be like watching a 3-D movie without 3-D glasses: It might be possible to get a sense of the action, but it would be too hazy and unreliable to be worth the effort. The Visualization Tool is the set of glasses if you like – only it works in five dimensions, not three. It helps the portfolio managers turn data into insight so they can make investment decisions with an improved understanding of the effect these decisions are likely to have on the portfolio.
It is extremely difficult for a fund of hedge funds business to create an edge in operational due diligence in comparison to a peer group. Similarly holding your own database of hedge fund returns is not game changer, but is expected. It is possible to be a better allocator of hedge fund capital when the firm has a deeper and more rounded insight into what factors contribute to manager returns. The mapping of those factors, and the use of factor analysis to create portfolios that control risk appropriately by design is a core competency of funds of hedge funds post Credit Crunch. The Rock Creek Group has that capability, and the interface of that capability with seasoned investment staff (via the Visuialization Tool) is seen by the firm as an advantage in a competitive sector.