
From Eurekahedge*
Hedge funds deploying shareholder activism as a key cornerstone of their investment strategy have attracted much attention as of late. This overview takes a quick review of their performance and asset growth over the last couple of years.
Graphic 1 and Table 1 show the performance of activist hedge funds relative to their global hedge fund peers, with the key observations summarised below.
Graphic 1. Activist hedge funds versus the Eurekahedge Hedge Fund Index
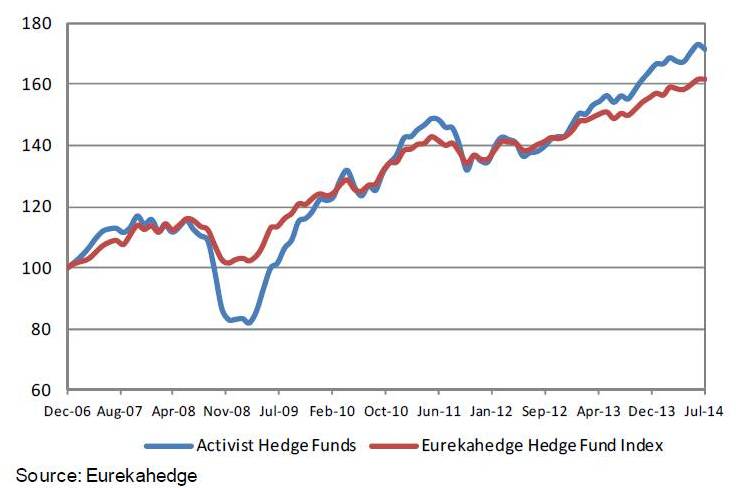
- Activist hedge funds have outperformed their peers for most of the time period under consideration, barring 2008 and 2011 when the funds reported steep losses.
- 2009 was by far the best year for activist hedge funds with gains of 46.97%, compared with 39.66% posted by
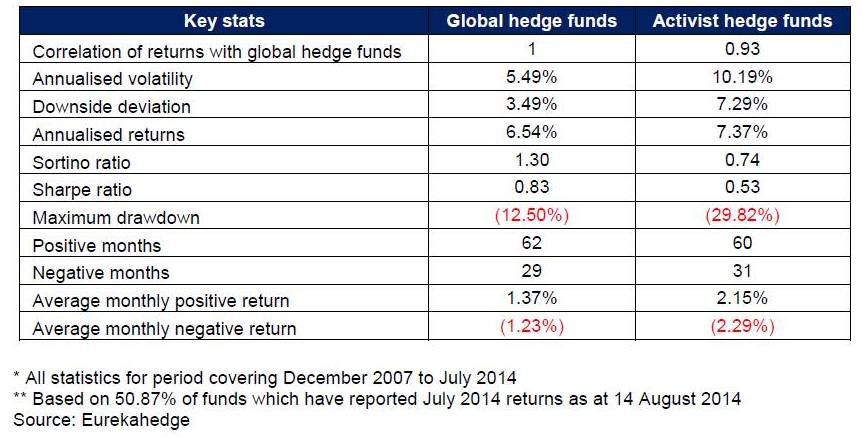
event driven funds and 20.97% posted by the average global hedge fund. - Activism is a risky strategy with a much higher risk profile – annualised standard deviation of 10.19% is almost
twice that for the average hedge fund globally. - Activist funds suffered a maximum drawdown of almost 30% compared with a 12.5% drop for their global peers.
- The average monthly positive return for activist funds stands at 2.15%, 78 basis points higher than that for their peers.
Table 1: Activist hedge funds key performance statistics
Graphic 2. and Table 2 show the key components of asset flows for activist hedge funds since 2007 with the salient features summarised below:
Graphic 2. Asset growth summary for activist hedge funds
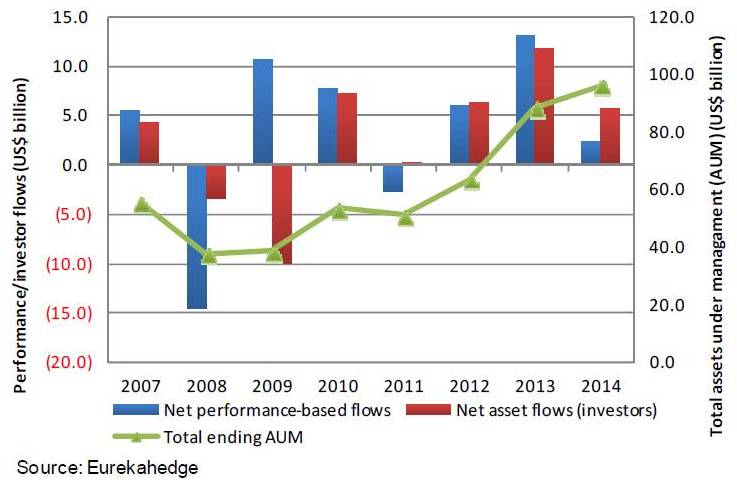
- Assets under management for activist hedge funds have grown by almost 73% since 2007, and currently stand at US$96.3 billion.
- Managers recorded their worst performance-based losses in 2008 – shedding US$14.5 billion as the average activist fund lost 28.14% during the year.
- These losses were mostly recovered in 2009, when activist funds registered performance-based gains of
US$10.7 billion. 2009 was the worst year for activist funds in terms of investor redemptions, with net asset
outflows of US$9.9 billion. Bear in mind that activist funds have slightly longer lock-up and redemption periods hence withdrawals are largely motivated by losses in the previous year. - Activist hedge funds grew their asset base by US$15 billion in 2010 on the back of performance-based gains and investor flows.
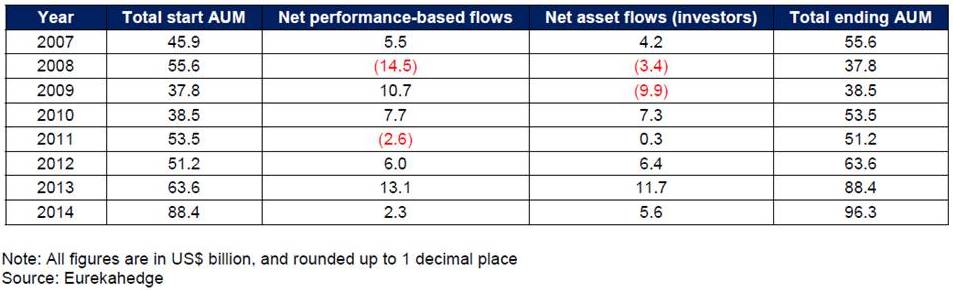
- Since 2012, activist hedge funds have seen strong growth, attracting net capital flows of US$23.7 billion, out of
which US$11.7 billion came in 2013 alone. Performance-based gains over this period have been equally
forthcoming with 2013 being a banner year where activist fund managers raked in performance-based gains of
US$13.1 billion. - As at July 2014, the average activist hedge fund is up 2.91% year-to-date; with performance-based gains of
US$2.3 billion and net asset flows of US$5.6 billion. For the moment, investors continue to pile their cash into
activist funds hoping to get a piece of the action as global M&A volumes continue to soar1.
Table 2: Capital changes for activist hedge funds from investor flows and performance
1 Dealogic, Global M&A Review – First Half 2014
*Extract from THE EUREKAHEDGE REPORT AUGUST 2014