
By Jason Hopper and Ken Johnson of A.M.Best*
Introduction
In A. M. Best’s recently published briefing, “Industry Interest in Non-Traditional Assets Continues”, we discussed the overall increased interest in non-traditional assets which are found on Schedule BA of the U.S. statutory filings. As allocations to Schedule BA assets (BA assets) have been increasing for non-life, life, and health insurers, there has been a correlating increase in its sub components, namely, investments in private equity (PE) and hedge funds (HF).
As interest rates remain persistently low, BA assets have provided insurers with the potential for higher returns to help mitigate the runoff of higher portfolio returns. Without a meaningful increase in interest rates, insurers have limited choices for investing cash from maturing securities and new premiums to obtain targeted risk-adjusted returns. Therefore, the current trend toward modestly higher allocations to non-traditional asset classes is likely to continue.
From an analytical standpoint, Schedule BA acts like a dumping ground for non-traditional assets of all shapes and sizes (oil and gas production, surplus debentures, guaranteed Federal low income housing tax credits, collateral loans, etc.) including private equity and hedge funds holdings.
This report focuses on trends in insurers’ investments specific to private equity and hedge funds, and qualitatively how risk is assessed for these asset classes. A.M. Best has aggregated PE and HF holdings that have been identified by companies within their annual statutory NAIC statements, with numbers of 1 through 13 under the “type and strategy” column in Schedule BA, Part 1
Industry Trends
Private equity and hedge fund investments combined for 26.3% of total BA assets across all three insurance industries mentioned earlier, or approximately USD 81.2 billion as of year-end 2014 according to our identified population. It should be noted that this compares to the USD 2.7 trillion the life/annuity, and USD 970.8 billion the property/casualty industries invest in bonds.
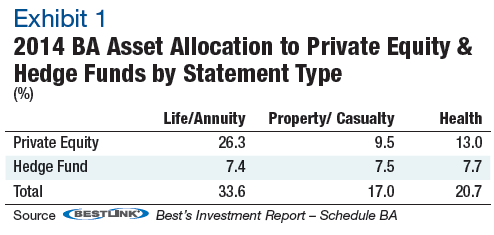
The life/annuity (L/A) insurance industry’s USD 56.5 billion exposure is the largest among the three industries, with 26.3% of BA assets invested in private equity funds and another 7.4% allocated to hedge funds (Exhibit 1). With shorter duration liabilities and generally higher liquidity needs, the property/casualty (P/C) industry holds USD 23.1 billion in private equity and hedge funds, while the health industry invests USD 1.6 billion. The P/C industry had the largest increase in exposure from 2013 at 9.3%, while the L/A industry increased 0.4% and the health industry had a 1.4% decrease.
A. M. Best recognizes that there are many conventions for attempting to classify PE and HF strategies but currently uses the convention followed by the NAIC Schedule BA filings. As you can see in Exhibit 2, PE is broken into 3 distinct subcategories while HF are further broken down into 10 distinct strategies.
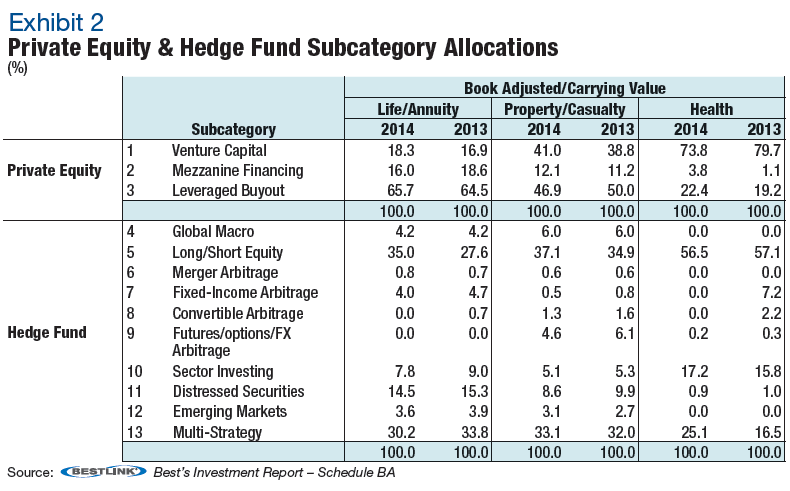
Within the hedge fund space, the two largest subclasses across all industries are long/short equity and multi-strategy investments. An equity long/short investment is a combination strategy in which the manager buys equities expected to rise in value and also sells equities expected to fall in value. Compared with market-neutral and statistical arbitrage managers, for example, long/short managers tend to have much longer holding periods (e.g. 3-5 years), and more concentrated portfolios consisting of 3-10 core positions, with perhaps an additional 20-40 smaller positions. Further diversification strategies can be implemented within long/short equity holdings through investments in value, growth, blend or bottom-up funds. While the larger allocations to multi-strategy funds are not surprising for increased diversification benefits, the life/annuity industry’s allocation of around 14% to distressed securities is seen as somewhat more risky, however, it is noted that it remains a minimal percent of overall capital and surplus.
Increased Interest from the Insurance Industry
Despite the liquidity issues, both property/casualty (P/C) and life /annuity (L/A) insurers, and to a lesser extent health insurers, use investments in private equity and hedge funds to obtain higher returns, while increasing overall asset diversification and potentially reducing risk from an overall portfolio standpoint.
A. M. Best notes that the increased interest in PE and HF comes from two fronts: those insurers who have been long-time investors in this space, and those that have not historically looked beyond their traditional asset allocation of bonds, stocks and mortgages. In addition, companies usually take one of two approaches to the management of alternative assets; build their own infrastructure and manager expertise, or a more naïve approach of outsourcing the management of a small portion of their portfolio to PE and HF third-party managers.
Other considerations include, but are not limited to, strategy, features, assessing risk/return characteristics, liquidity, size, and manager track record. Recognizing the risks inherent in these investments, along with the limited transparency provided by the statutory statements, hedge funds and private equity funds carry the highest NAIC risk-based capital factor for investments.
Are There Rating Concerns?
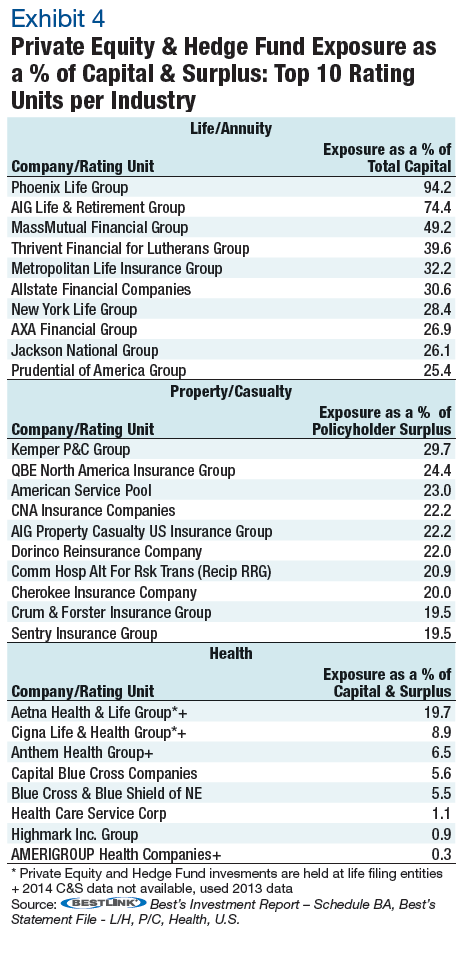
A. M. Best’s ratings represent assessment of rating units as defined by A. M. Best. As of year-end 2014, the top 10 P/C rating units account for 74.4% of industry PE and HF holdings; the top 20 account for 90.2%. Only 3 P/C rating units had over USD 1 billion worth of holdings – 1 rated Superior, 2 rated Excellent. The top 10 L/A rating units account for 78.6% of industry PE & HF holdings: the top 20 account for 93.6%. Eleven L/A rating units had over USD 1 billion worth of holdings – 8 of which were rated Superior and 3 rated Excellent.
Therefore, generally speaking, there are some concentrations in the industry in PE and HF investing but they remain clustered around higher rated rating units. Most of these rating units have strong risk-adjusted capital levels (according to Best’s Capital Adequacy Model or BCAR) and demonstrated an expertise in the asset classes; although this doesn’t guarantee favourable future performance. A. M. Best does expect companies to understand what they invest in, and how the investment fits in relative to an investment portfolio strategy, and an asset/liability management context.
Of A.M. Best’s rating unit population, 39.4% of life/annuity rating units that held BA assets had at least some exposure to PE or HF in 2014, or 24.0% of the entire life/annuity rating unit population. Similarly, one-third of property/casualty rating units that hold BA assets have exposure to PE or HF, or 13.6% of all rating units. While having a much smaller number of rating units, 9.5% of all health rating units had exposure to HF and PE, or 18.2% of health rating units that hold BA assets.
Rating units with a superior rating from A. M. Best (aaa, aa+, aa, aa-) hold the large majority of PE and HF exposure in the life/annuity industry with 68.8% of the total exposure, while rating units with

A. M. Best notes that in general, higher rated companies tend to have more resources to commit a meaningful investment into alternative assets, and then decide to either create the necessary infrastructure to manage alternative asset classes, or pay outside investment managers. Other insurers that are either new to alternatives, or have not yet made an investment into PE or HF, generally find it more efficient to use an outside manager, and potentially improve their diversification through a fund-of-funds structure.
It is noted that AIG has rating units in both the L/A and P/C industries, both of which lead their respective industries in total dollar holdings. AIG’s USD 5.4 billion in the P/C industry and USD 7.3 billion in the L/A industry result in a total combined USD 12.7 billion in exposure or a little more than one-third of capital and surplus. Separately, Allstate holds a combined USD 1.8 billion between both industries – relatively evenly split – for a combined total of less than 10.0% as a percent of capital and surplus.
For most traditional asset classes, A.M. Best believes the industry historically has demonstrated the appropriate expertise, based on reported asset impairments. However, for many insurers, the track record of their experience in investing in PE and HF is not that long. With the level of exposure to private equity and hedge fund investments growing, albeit modestly, there is less certainty in determining valuations, liquidity, and credit quality. A.M. Best believes at some point this could lead to insurers underestimating their investment risks. Hampered by the limited transparency of Schedule BA, A.M. Best continues to spend additional time with companies’ management as part of the enterprise risk management (ERM) review to ensure they understand the additional investment risk they’re assuming. However, it should be noted that BA assets generally do not back specific products from an asset/liability management standpoint (although some life/annuity rating units with long-tail liabilities do this). Instead, it generally represents “excess” surplus being utilized in some form of efficient frontier portfolio strategy.
Summary
A. M. Best views modest allocations to PE and HF as it would many other traditional asset class. Our analysts expect companies to be able to discuss these investments in detail, including strategic use, performance, liquidity, and how fair value is measured. This is true whether or not an outside manager is utilized. Similar to any other asset class, there should not be significant concentrations whether by manager or investment strategy. As always, companies should be able to explain risks they choose to avoid, keep or hedge, including those taken in the investment portfolio.
Most of this alternative asset risk is being borne by the higher-rated insurers that have the capital and expertise to better absorb the risk. A.M. Best remains committed to closely monitoring the rising trend in alternative investments and regularly reviews capital charges to ensure appropriate treatment of this growing asset class. At this point in time, the overall exposure is not excessive for most companies. However, the trend is up, and when added to other risky positions, the aggregate industry exposure to risky assets to capital and/or surplus is noticeable.
*This is an edited version of Best’s Special Report on U.S. Life/Non-Life Companies “Spotlight On Private Equity and Hedge Fund Exposure”. Reproduced with permission.
Related article:
2 Responses to “A.M. Best on Insurance Industry Hedge Fund Exposures”
Read below or add a comment...