
By Georg Reutter and Matthew Barrett of Kepler Partners
Below we review each sub-sector in the Absolute Hedge universe, identifying the most important players and notable performances last year.
Managed Futures
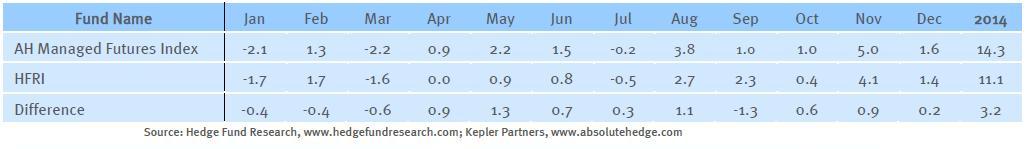
After several years of poor or disappointing returns, Managed Futures were the standout sector in 2014. The sector got off to a poor start with a loss of 2.1% in January, mainly thanks to long equity markets positions that had been held after 2013s strong rally. It was not until the second half of the year that returns picked up materially with many funds profiting from the continued trends in bond markets (long) and commodity markets (short), particularly energy markets.
FIG 1: MANAGED FUTURES – UCITS – % MONTHLY RETURNS
 (CLICKING ON A TABLE WILL OPEN THE FULL SIZE VERSION IN ITS OWN WINDOW)
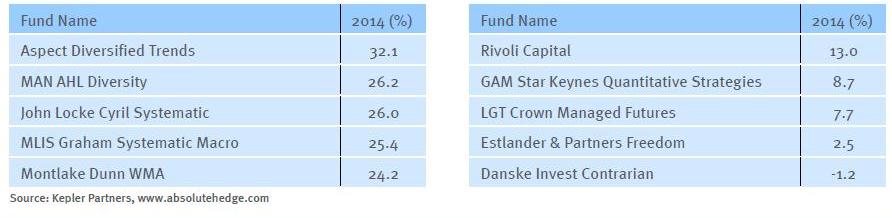
The top-performing fund in the sector was the Aspect Diversified Trends Fund up 32.1%. The fund made all of the year’s returns between August and December, including a single monthly gain of 11.8% in November. Short energy positions contributed over 6% of the monthly return alone. Recent changes to the ESMA ruling on swaps meant that several funds restructured themselves away from TRS structures to certificate structures, with financials only (excluding commodities) products also popular. 2014 marked the first year of a significant performance differential between these products thanks to the strong commodities trends. For example the DB Systematic Alpha Index Fund (Winton) delivered 14.7% while the Lyxor / WNT Fund (Winton excluding commodities) was up ‘only’ 10.3%. We are of the opinion that diversification is central to managed futures investing, and commodities clearly play an important role in this. While accessing commodities via certificate structures isn’t within the spirit of the UCITS rules, the structures are compliant under the current regime, and for us the benefits that commodities bring outweigh the risk of future regulatory change.
A major new launch in the space was the Graham Tactical Trends Fund, which launched in September. The investment process builds upon Graham’s well established trend following capabilities (without the systematic macro elements of their investment process), but the main feature of note is the fee – at 0.50% (TER capped at 1%) and a 10% performance the fund is extremely competitively priced compared to the incumbents and suggests the trend for lower fee products is moving across all alternative UCITS sectors.
FIG 2: TOP / BOTTOM 5 PERFORMING FUNDS: MANAGED FUTURES
Multi Asset
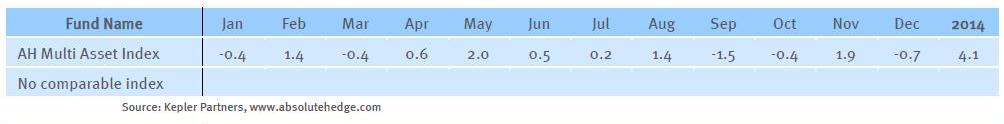
With both equity and bond markets advancing on the year and in many cases indices outperforming active managers it is not surprising that the asset allocation based strategies worked well, with the AH Multi Asset index advancing 4.1%. Risk parity strategies had a particularly strong year with the AC Risk Parity 12 Fund up 11.2% for the year thanks largely to long exposure to bonds and equities. In the actively managed space, the two bellwether funds, Troy Trojan and Ruffer Total Return had good years advancing 9.0% and 6.5% respectively. Ruffer’s typically un-consensual asset allocation paid dividends with bond yields continuing to fall and the US dollar appreciating. For the Trojan fund it was core stock exposure within the US market that drove performance.
FIG 3: MULTI ASSET – UCITS – % MONTHLY RETURNS
Credit
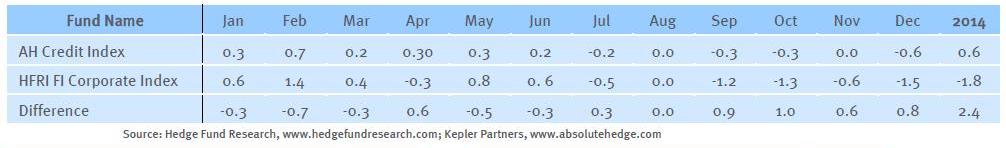
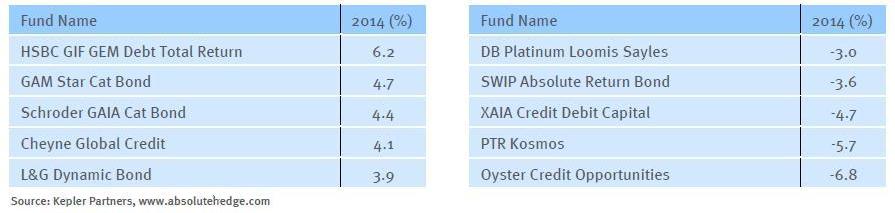
Fixed Income and credit allocations remain a challenge for most investors, who have in the past relied on this part of their portfolio for steady returns and income. With yields on government debt at record lows, the search for ‘alternative income’ has forced investors to look further and farther afield to generate these ‘safe’ returns. The liquid alternative space has undoubtedly gained from this trend with several strategies reinventing themselves as fixed income alternatives. One such sector is the catastrophe bond market which has seen significant assets flow over the past year, prompting investors to “accept the lowest relative yields in almost a decade” according to a Bloomberg article published in June (‘Buffett Warning Unheeded as Catastrophe Bond Sales Climb’; Jun 17 2014). Whilst returns for the sector (and UCITS funds) looked attractive last year (see Fig 5), Buffett sums up the problem we see with the space neatly: “The hurricane does not know the rate that was charge for the hurricane policy, so it’s not going to respond to how much you charge – and if you charge an inadequate premium, you will get creamed over time”. Having said that, the fact that these bonds are (pretty much) guaranteed not to correlate with any other asset class make them undoubtedly an attractive proposition (until you suffer a loss of course).
FIG 4: CREDIT – UCITS – % MONTHLY RETURNS
Given the strong demand for cat bonds and the fact that Mother Nature was kind to us last year, it is not surprising to see two Cat Bond funds amongst the top performing credit funds last year. Both the GAM Star Cat Bond Fund and the Schroder GAIA Cat Bond Fund are at capacity and no longer accepting superscriptions from new investors. Given this was a ‘good’ year for the sector it is unlikely that we will see much higher returns from this space going forward, whilst at the same time the risk of a large ‘event’ to the downside being exactly the same as before. Fundamental long short strategies credit had a challenging year overall, and as such we would highlight the solid 4.1% generated by the Cheyne Global Credit Fund under the management of Sean Boland, John Weiss, and David Peacock. The fund provides investors with exposure to credit risk with very low duration through credit default swaps, offering a credible alternative for investors concerned about the impact of duration on their portfolios.
FIG 5: TOP / BOTTOM 5 PERFORMING FUNDS: CREDIT
Looking at the performance of the closed ended funds with significant credit exposure shows that these managers were generally able to outperform their UCITS peers last year. DW Catalyst Ltd was the top performing single manager fund, gaining 7.4% for the year. NB Distressed Debt 4.3% and CQS Diversified Ltd 2.3% were also both able to post respectable numbers, although remained behind expectations. The top performing multi manager credit fund was Acencia Debt Strategies which was up an impressive 8.1%, making it the top multi manager closed end fund and the top performing credit fund in our universe.
Equity Long Short
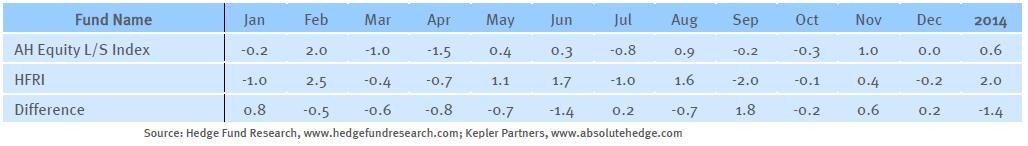
The AH Equity Long Short Index was up 0.6% in what was one of the most difficult years for active equity managers in the recent past. March and April saw particularly aggressive sector rotations away from speculative sectors such as technology and into more defensive sectors. This caught many managers off guard, and was further compounded by the fact that equity markets rose at the index level, resulting in manager being hit from both sides (their long and their short books).
FIG 6: EQUITY LONG / SHORT – UCITS – % MONTHLY RETURNS
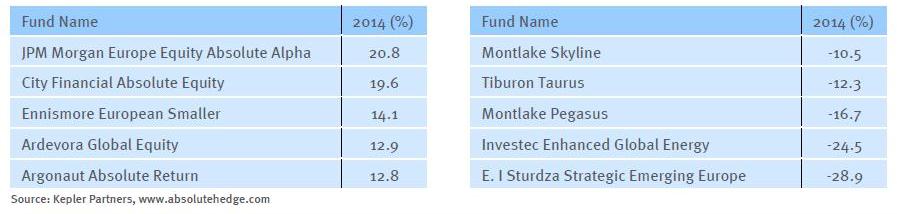
As we have already observed, there was significant dispersion between the best and worst equity strategies, with many of the sector specialists and emerging markets focussed managers appearing towards the bottom of the league tables. The JPM Europe Equity Absolute Alpha Fund had a phenomenal first year delivering 20.8% having launched at the end of December 2013. The fund is managed by the behavioural finance team at JP Morgan which is headed by Michael Barakos, David Allen and Nicholas Horne. The fund is a highly diversified (200-400 positions) European equity long short product targeting low beta to markets. The investment philosophy is based upon three key pillars – value, momentum, and quality with stocks positioned long or short accordingly – something which worked very well in 2014. Credit must also go to Barry Norris who guided the Argonaut Absolute Return Fund to a 12.8% return. This fund launched in 2009 and has not had a down year since inception, rewarding its more adventurous investors. Demand for equity based strategies remained high, with strong asset flows, particularly in the first half of the year as investors continued to allocate capital to equity markets.
FIG 7: TOP / BOTTOM 5 PERFORMING FUNDS: EQUITY LONG SHORT
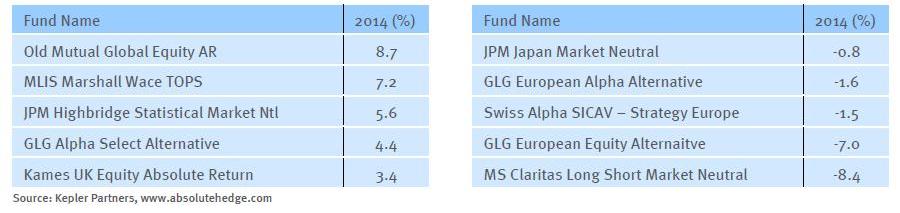
Market Neutral
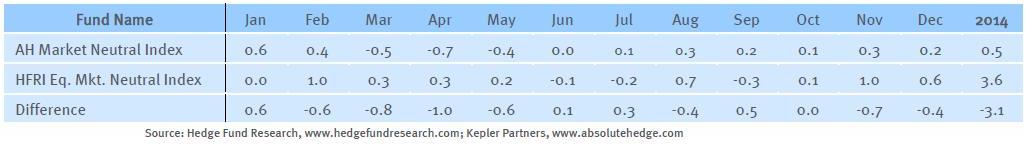
Market neutral strategies were also caught out by the sharp sector rotations suffering a difficult couple of months between March and May, but ultimately finishing the year up 0.5%. In common with the more directional product, Marshall Wace’s MLIS MW TOPS Market Neutral products had a particularly strong year delivering 7.2% (versus 7.5% for the directional product!).
FIG 8: MARKET NEUTRAL – UCITS – % MONTHLY RETURNS
Given the difficulties experienced by the active management community it comes as no surprise that two systematic products sit towards the top of the peer group. The Old Mutual Global Equity Absolute Return had a particularly strong year delivering 9.2%, the strongest performance in the universe. The fund had a very strong finish to the year up almost 4% in the final quarter of the year. The short book was the main driver of returns with energy shorts a key contributor. Another systematic market neutral strategy performing well was the JPM Highbridge Statistical Market Neutral fund which gained 5.6% for the year.
FIG 9: TOP / BOTTOM 5 PERFORMING FUNDS: MARKET NEUTRAL
Macro
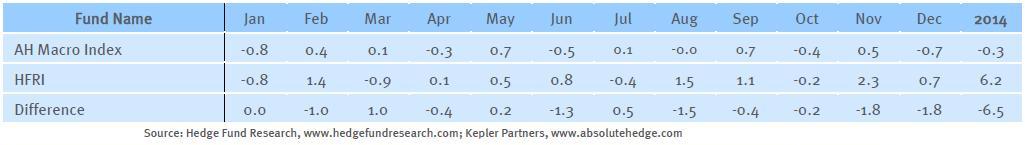
After several disappointing years for the strategy, macro investors were hoping that 2014 would mark a change in their fortunes. The reality was a lot more mixed with the AH Macro Index down 0.3% in 2014. Underlying the headline figure there were some very strong performances from several of the best-known managers in the space, who were able to capture some of the large moves in rates and FX markets last year.
FIG 10: MACRO – UCITS – % MONTHLY RETURNS
The top-performing fund in the space was the LGT Alpha Generix Global Macro Fund, a $291m systematic macro strategy managed by LGT Capital in Pfaffikon. We have met with the management team on several occasions and noted on both occasions the strategies roots in risk parity and trend following, both of which performed well in 2014. In the discretionary macro space praise must go to Adrian Owens who steered his flagship £1.1b GAM Star Global Rates fund to a 6.1% gain. FX positions were the driver behind his 2014 returns, particularly long positions in the USD and the MXN. Finally, recognition must also go to Standard Life GARS which gained a very respectable 5.7% for the year, with gains driven by a range of positions including longs in the USD, US equity tech vs. small cap, and Australian forward-start interest rates which all contributed more than 1%.
FIG 11: TOP / BOTTOM 5 PERFORMING FUNDS: MACRO
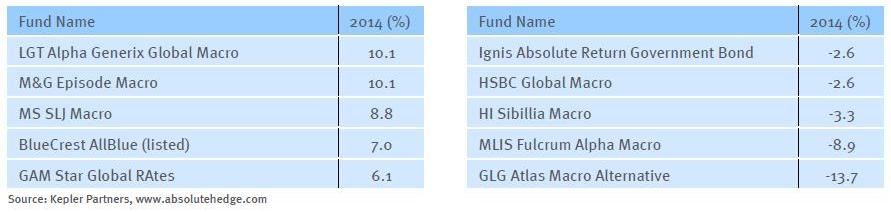
There is no doubt that the past few years have not been kind for macro managers. With interest rates anchored at historic lows by central banks the opportunity set for rates trading in particular has been challenging. As seen with managed futures, there is often an element of strategy mean reversion and given the increased divergence in global monetary policy we would not be surprised to see a revival in the fortunes of discretionary macro managers.
Event Driven
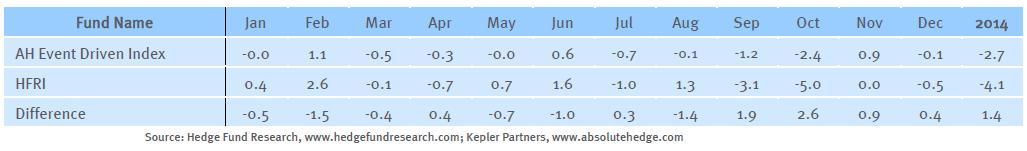
It is fair to say that 2014 was a mixed year for event driven hedge fund managers. On the one hand they saw strong inflows from investors looking to exploit the higher levels of corporate activity, particularly in the US. On the other side, performance was disappointing with the AH Event Driven Index losing 2.7% for the year with a hefty 2.4% loss in November alone.
FIG 12: EVENT DRIVEN – UCITS – % MONTHLY RETURNS
One of the key drivers behind the uptick in M&A activity was so called ‘tax inversion’ deals where US companies were buying their overseas competitors and then re-domiciling into the targets lower-tax jurisdiction. One such deal was AbbVie’s proposed takeover of Shire, which as well as much lauded strategic benefits involved a healthy tax saving. This was a very popular deal for many event driven managers who were able to earn what looked to be attractive deal spreads from the transaction. The deal break came out of the blue and saw many managers suffering sharp losses on their positions. The DB Paulson Global Fund was down 14.4% intra-month and the MLIS York Event Driven Fund was down 8.12%, highlighting how exposed managers can be to single trades. This idiosyncratic event saw M&A spreads widen on the vast majority of transactions (even non-inversion deals) with the shockwaves felt by most managers. Arguably this should set the scene for improved returns going forward with corporate activity remaining high and deal spreads trading wider than before. Given the significant October loss, credit must go the MLIS York Event Driven Fund which advanced 6.0% for the year, after strong early months as positions in special situations such as American Airlines, Air Products, and Hillshire Brands rallied sharply.
FIG 13: TOP / BOTTOM 5 PERFORMING FUNDS: EVENT DRIVEN
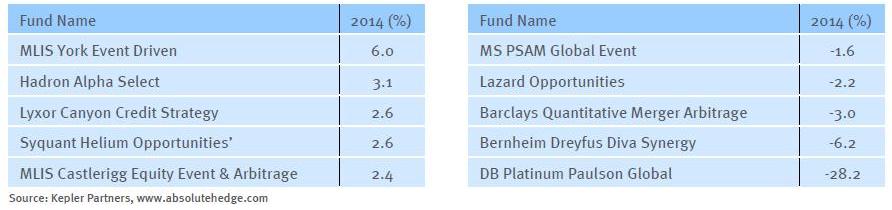
The asset raising environment for event strategies was strong with the sector adding well over 1 billion pounds in assets. The MS PSAM Global Event Fund was one of the main beneficiaries, closing to new investors at €1bn. In June Schroder’s bought the Paulson International strategy into UCITS launching the Schroder GAIA Paulson Merger Arbitrage Fund with day one assets over £300m, making it the largest new launch of 2014. Despite a difficult first few months with the fund down 7.4% by the end of the year the fund continued to attract inflows with the fund now $586m in size. Although not in the UCITS space investors also supported Bill Ackman’s Pershing Square Holdings which reversed into a listed closed end structure attracting almost £4bn of capital.
Kepler Partners is a Fund Research and Distribution business. Kepler Partners LLP is retained by AcenciA Debt Strategies Ltd, Aquila Capital, KKR / Avoca Capital, BH Macro Ltd, BH Global Ltd, CQS Diversified Ltd, DW Catalyst Ltd, Marshall Wace LLP, Silvaris Capital and Verrazzano Capital for marketing services. www.keplerpartners.com
Related articles:
Graphic Of The Day – UCITS v Non-UCITS Hedge Funds in Europe (Dec 2014)
UCITS Hedge Funds – Graphics of the Day (Sep 2014)